

Greening Supply Chains - Green Bunkering Strategy
27 June 2024
The way Towards a Green Bunkering Strategy
A Swedish Pilot Example for the Baltic Sea Region.
For the shipping industry and ports to deliver on the long-term target of net zero carbon emissions, a transition from today’s fossil fuels towards fossil-free alternatives needs to be introduced together with energy efficiency and other measures to reduce the need for marine fuels (Malmgren et al., 2023). The quantities of fuels consumed on-board ships as well as within and connected to ports are significant (Winnes & Styhre, 2017). Today, ships consume approximately 280 million tonnes of fuel annually, and more than 99% of the world fleet runs on fossil-based conventional fuel or LNG (DNV, 2023a).
This report takes a deep dive into the Swedish shipping and port sector. In Sweden, some 30 TWh of fossil marine fuels are sold annually to domestic and international ships (Swedish Energy Agency, 2022), with fairly large variations in recent years, but with a steady rise since the 90s. In addition, terminals and ports also consume large quantities of diesel fuels (Winnes & Styhre, 2017). However, official statistics for international shipping are unreliable and the use of electricity in ports are missing (Vierth, 2023).
Interviews with ports and terminals (Chapter 5.1 Stakeholders’ view on present and future development) show clearly that many port authorities are investigating the possibility to support the shipping companies that call their ports with the fuels they plan to use for their ships in the future. The ports need to do that on a commercial basis and understand financial and other risks, and make sure the investment will be long-term profitable. In addition, many ports and terminals have plans for their own operations to become net-zero carbon over time. Some ports also have targets for their customers’ operations (shipping companies, freight forwarders, etc) to reduce their climate footprint.
At the time of this study (2023– spring 2024), some shipping companies ordering new ships have taken steps towards alternative marine fuels with lower carbon impact (DNV, 2023a). This development means that ships in the order books today include methanol-ready ships, possible to fuel with either MGO (marine gas oil) or methanol, and LNG (liquid natural gas) dual-fuel ships, possible to fuel with LNG, MGO, or LBG (liquified biogas). However, approximately 50% of the ships in the order books still plan to use conventional fossil fuels. Further, an absolute majority of the existing ships are running on conventional fuels, and many have many years left in operation.
Driving forces for changes and market aspects
A global shift towards a more efficient, cleaner and less carbon emitting transport system has been ongoing for many years. However, the shipping sector, being international, has fallen behind the development of land-based operations within Europe (European Maritime Safety Agency, 2021). Until recently, there were few and non-strict measures in place to phase out greenhouse gases (GHG) from ship operations (Prussi et al., 2021). Fuels to ships in international as well as domestic traffic are sold without any taxes and without costs connected to carbon or other emissions (Fridell et al., 2022). However, this will change dramatically with several measures connected to the EU Fit for 55 packages. Shipping will be a part of the European Emission Trading System (EU ETS) from 2024, the directive FuelEU Maritime stipulates how the greenhouse gas intensity of fuels used by the shipping sector will gradually decrease over time, and the alternative fuels infrastructure regulation (AFIR) stipulates among other things under which circumstances ports needs to offer OPS connections (i.e., onshore power supply). All in all, many of these directives and regulations sets the path towards a more sustainable shipping sector.
The EU Fit for 55 packages include ships calling European ports (European Parliament and Council, 2023b). However, for policy instruments to be of greater benefit, global policy instruments are required (Fridell et al., 2022). Many regulations are now also discussed by the International Maritime organization (IMO), the United Nations specialized agency with responsibility for the safety, security, and environmental aspects of international shipping (MEPC, 2023a). Forthcoming regulations are further described in Chapter 3.2 National, EU and IMO Polices and EU funding programs.
Another driving force is linked to the sharp increase in the number of companies around the world setting voluntary climate goals. One example is the Science-Based Targets Initiatives (SBTi, 2024), where committed companies must reduce their emissions to meet the goals of the Paris Agreement – limiting global warming to 1.5°C above pre-industrial levels. This is an important driving force for companies to also reduce their transport emissions if Scope 3 is included in their targets (Malmgren et al., 2023). In December 2023, more than 6 800 companies were committed globally to SBT initiative, including 309 Swedish companies, see Figure 4. As many as 97% of the Swedish companies have also included Scope 3 emissions with reduction targets for inbound and outbound goods transport (SBTi, 2024).
Green bunkering and charging strategy for Swedish ports
The aim of the green bunkering and charging strategy for Swedish ports are to create conditions for, and increase the possibility for, charging and bunkering of renewable low-carbon marine fuels in Swedish ports. The strategy provides a summary of the current situation and include a first assessment of the potential future demand for production capacity, bunkering and charging facilities in ports.
Present production sites, bunkering and charging facilities
Energy demand – ships calling Swedish ports
Port call statistics (PCS) for all ships arriving and departing at Swedish ports were collated for 2022 (Swedish Maritime Administration, 2023). The ships are categorized according to the International Maritime Organization’s (IMO) 4th GHG report (Faber et al. 2020) based on their size and type as provided in the PCS and further harmonized with ship parameters found in the Sea web’s ship registry (S&P Global, 2024).
The ships analysed here are > 300 GT in size and include those transporting goods, such as tanker, bulk, container, RoRo, vehicle carriers and general cargo ships, as well as those moving people such as cruise ships and combined goods and passenger transportation with RoPax. The energy usages of many smaller vessels are not included in this analysis, such as fishing vessels, road ferries, public transport, small working vessels such as pilot boats, pleasure boats, tugs, dredgers, and bunker ships. Also, ice breakers have not been included in the PCS. Assigning ‘home’ ports to many of these, especially, smaller vessels, e.g., pleasure craft, is not feasible and would introduce more difficulties for port-based analyses. While the inclusion of such ships would provide a more holistic overview of Swedish fleet energy usage, the impact of such vessels is not expected to be significant on a national scale and would be better investigated as separate cases, which is beyond the scope of this project.
The total energy used by ships visiting Swedish ports in 2022 was 14.0 TWh including domestic and international shipping. An average of 7% total energy usage was consumed in the port and the remaining 93% consumed at sea. The top twenty highest energy demanding ports consumed just over three quarters (76%) of this total, with the remaining Swedish ports consuming the remaining 24%.
Within the top 20 ports, between 5 and 11 % of total energy consumption was in the port itself with the remaining consumed at sea. On a per port basis, Gothenburg consumed the greatest fraction of that energy (17.1%), followed by Stockholm with just under half that value (7.4%), then Trelleborg (5.6%).
Port energy usage clusters into geographical regions of high activity have been identified:
- The most significant of these are: the region of Stockholm, extending southwards into Södermanland and westwards inland; the west coast including Gothenburg; and the South including Halland, Skåne and Blekinge.
- Ports within these regions account for 32%, 28% and 21% of total energy usage respectively.
This indicates that while Gothenburg is the largest energy consumer on an individual port basis, the Stockholm region is actually greater when considering ports beyond Stockholm itself, albeit over a larger geographical area. Additionally, Oskarshamn and Visby on the island of Gotland are prominent on the east coast and account for 6% of total energy use.
Many ports in the top 20 are dominated by traffic of one specific ship type (see figure below). In some instances, this dominance is nearly exclusive. For most ports, the dominant ship type is RoPax, as is the case for Stockholm, Trelleborg, Nynäshamn, Malmö, Ystad, Visby, Kappelskär, Karlskrona and Norvik. RoPax vessels are responsible for a third (33%) of the total energy usage of any vessel type and are associated with only a few, ports such as Trelleborg, Stockholm and Ystad, all of which have high energy demand (see figure below).
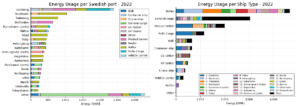
Energy demand for the 20 highest energy using ports in Sweden 2022 split by (a) highest energy demanding ports and (b) ship category.
In contrast, the next largest category of general cargo ships (22%) are more likely to call at a greater number of less energy demanding ports that are not found in the top 20. General cargo ships dominate the port calls at Oxelsund, Luleå, Uddevalla, Oskarshamn, Norrköping and Gävle, found in place 14 or higher of the top 20.
The third largest category of product tankers uses 14% of the total energy, of which half is associated with calls to Gothenburg and Brofjorden. Additionally, RoRo Cargo (8%) and oil tanker (3%) energy usage is dominated by calls to Gothenburg, whereas LG tankers (4%) are dominated by calls to Stenungsund, and Cruise ships (3%) call mostly at Stockholm.
The vast majority of energy usage concerns international shipping. 71% of energy usage at the top twenty energy demanding Swedish ports can be ascribed to port calls to or from 18 countries. Germany is the country with the highest associated energy demand (at least 13%), followed by domestic port calls in Sweden (at least 12%), and then Finland (at least 10%).
While the domestic share of total energy usage is 12%, on a per port basis only Visby, Nynäshamn, Gothenburg and Oskarshamn have domestic port calls reaching over 5% of their total energy usages. For Gothenburg specifically, ships traveling to / from the neighbouring countries of Belgium, Germany, the U.K. and Denmark are most prominent, comprising over half (55%) of all energy consumption to and from the port. Including Sweden and further neighbouring countries of Norway, the Netherlands, Finland and Poland, this increases to over two thirds of the total (69%).
Charging facilities and production sites
The capability to connect to landside electricity supplies for charging of vessels is available in 11 of 52 Swedish public ports, which the overwhelming majority is tailored for RoPax vessels (84%) and RoRo vessels (5%) with the remaining 11% for General cargo. Only Stockholm and Norvik, have capacity for charging general cargo.
There are currently four biogas liquification plants in Sweden (see Figure 38), one is found in Lidköping on the coast of lake Vänern, one is located on the south coast in Nymölla, one in Linköping, and one is located in Stockholm, which is the most northern of all facilities.
Bunkering of marine fuels
A large majority of bunkering activities in Sweden is performed in Port of Gothenburg or at anchor off the Swedish west coast between Gothenburg and northern Denmark. Due to limited data availability, it is difficult to identify how much, but roughly 70-80% of all bunkering in Sweden today is carried out in this geographical area. Reasons for being a busy bunkering location are the location at the gateway to the Baltic Sea, local refineries in Port of Gothenburg and several more refineries just north of Gothenburg, competitive prices and many bunker suppliers offering all the main marine fuel grades, including biofuel blends (integr8fuels, 2024).
Fuels handled in the port include MGO, marine distillate, different types of fuel oils, LNG, LBG and methanol. Approximately 1.9 million m3 sourced from Port of Gothenburg, correspond to roughly 19 Twh, including around 2 500 bunker operations yearly (Port of Gothenburg, 2024). Additional volumes are sourced from other places to this area.
Bunkering in other geographical areas in Sweden other than the west coast, including foremost bunkering of timetable-based shuttle services between two ports, including domestic services. Examples of shipping segments bunkering outside the Gothenburg area are the ferry traffic between Gotland and Swedish mainland, the RoPax ferry operations between Finland and Sweden etc.
Future demand for production sites, bunkering and charging facilities
The development of future demand is difficult to predict as it is influenced by many factors as well as interlinked behavior and diverse goals from multiple stakeholders. On the national level, only some general aspects can be concluded as the local conditions are crucial to the different developments and singular stakeholder initiatives creates demand at scale. If we look at the future demand at Swedish national scale and the target year of 2035, the Swedish energy administration currently expects the fuel bunker demand in Sweden to remain the same until 2035. We therefore expect no increase in demand, but the production and bunkering pattern might change.
There are several key aspects of different marine fuel pathways at the national level. The demand on a national level is in this report considered to be stabile up until 2035, with some flexibility regarding where the fuel is produced. The primary activity in Sweden will therefore be to shift the fuel supply from fuels with high greenhouse gas emissions form a life cycle perspective to those with low emissions. This will require a drastic increase in use and in production. We have throughout this report assessed the current state of marine fuels, including the types of fuels being used, their environmental impact, and existing regulations.
The fuel availability for the shipping sector is a key factor to the future development, and with limited feedstocks and diverse use cases where different technologies in terms of propulsion etc. are the most relevant, we see that a diverse mix of fuels at the national scale is beneficial and likely required. The limited mapping potential of production sites at the national scale leads to limitations in the analysis. However, we can conclude that there are interests in biofuels (LBG in particular), electrofuels, and electric propulsion (/when it is technical applicable). There is a direct interest in electrofuels in Sweden today, with for example initiatives at scale in electromethanol, and the feedstocks considered are primarily renewable with renewable electricity and biogenic carbon dioxide in focus.
However, the conditions for fuel availability, port infrastructure etc. is expected to vary greatly between Swedish regions and ports, calling for detailed analysis at regional level as well as increased monitoring at a detailed level. Understanding potential pathways and their relevance requires a multi-dimensional approach that integrates local context, stakeholder engagement, legislative frameworks etc
Transfering the Solution to other Port Regions
A guideline for the development of a national bunkering and charging strategy is included in Chapter 6.2 Guidelines for the development of national/regional bunkering and charging strategy. The purpose is to provide other countries around the Baltic Sea with a methodology to analyse supply and demand of fuels and charging facilities in ports to serve the shipping industry, but also surrounding industries and terminal equipment, today and in the future.
Based on our experiences in the Blue Supply Chains project, the following steps are suggested to develop a national or regional bunkering and charging strategy for ports:
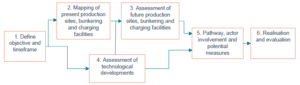
Schematic overview of methodology for development of national/regional bunkering and charging strategy.
Methodology
The following methods have been used for collecting data and information for the analysis of low-carbon fuels and development of the bunkering strategy:
- Literature reviews,
- Interviews with different actors,
- Collaboration and knowledge sharing at workshops and meetings with representatives of other ongoing research projects, government assignments and industrial initiatives
- Assessments of feasibility, environmental aspects, and techno-economic systems of low-carbon fuels production in a Swedish setting and specific market segment, and
- Assessments of energy needs of vessels calling at Swedish ports.
Interested on detailed describtions of the methodologies used? Have a look at the full report available for download!

Interactive map showing pilot locations. Use the arrow keys to move the map view and the zoom controls to zoom in or out. Press the Tab key to navigate between markers. Press Enter or click a marker to view pilot project details.
details
-
Homepage
-
Project typeCore Project

-
ImplementationJanuary 2023 - December 2025
-
StatusCompleted
-
Contribution to EUSBSRPolicy Area Transport, Policy Area Ship

-
Target groups
- Business support organisation
- Infrastructure and public service provider
- National public authority
-
Social media
-
Additional links
-
Tags