

Preliminary survey reveals tough conditions for fish populations in Lake Velnezers
19 March 2024
What can we learn about Lake Velnezers from the first fish survey?
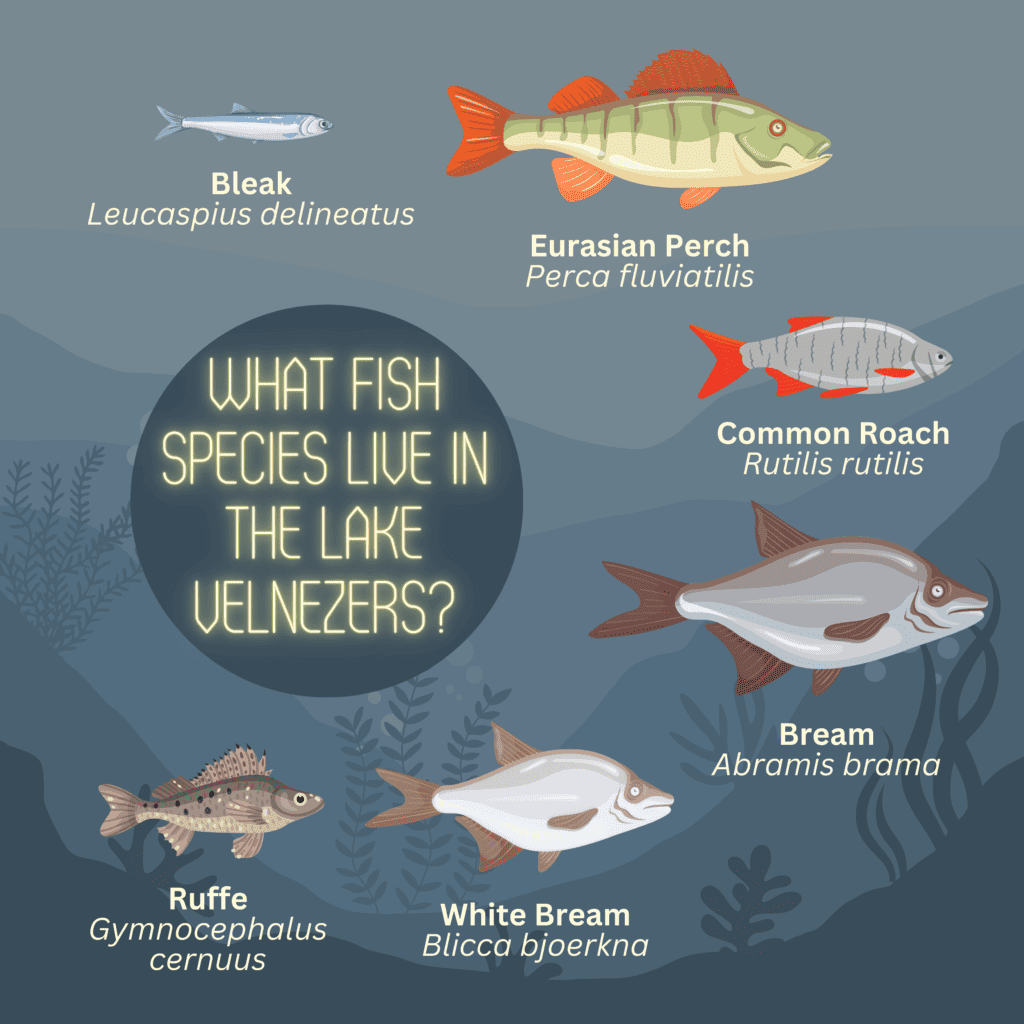
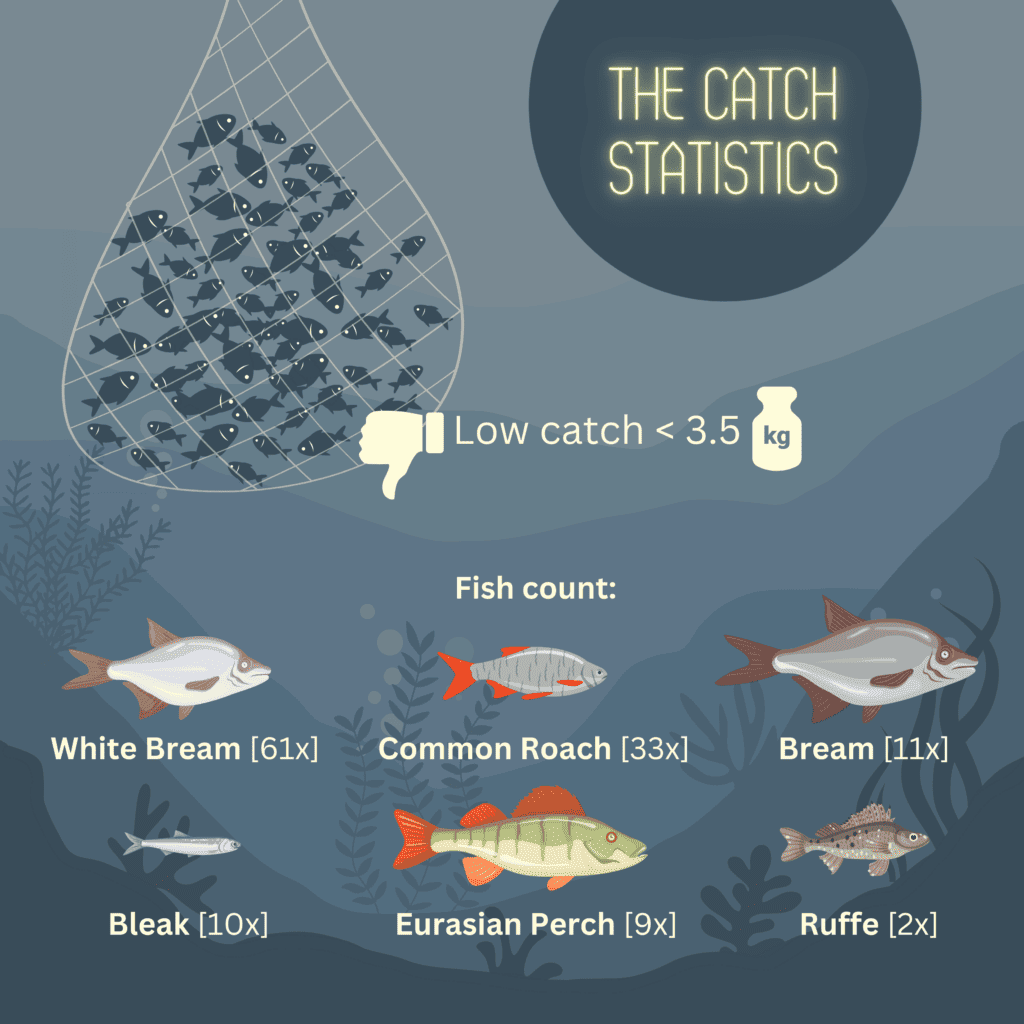
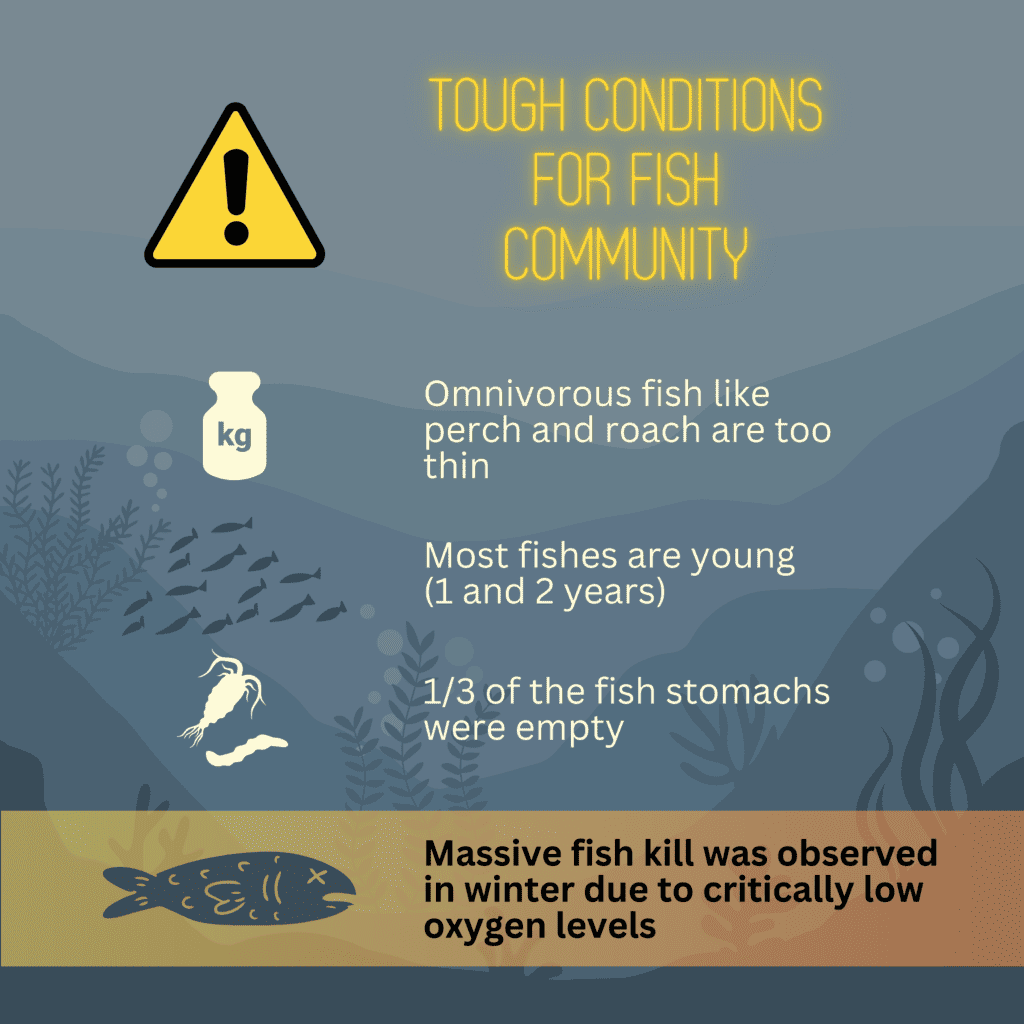
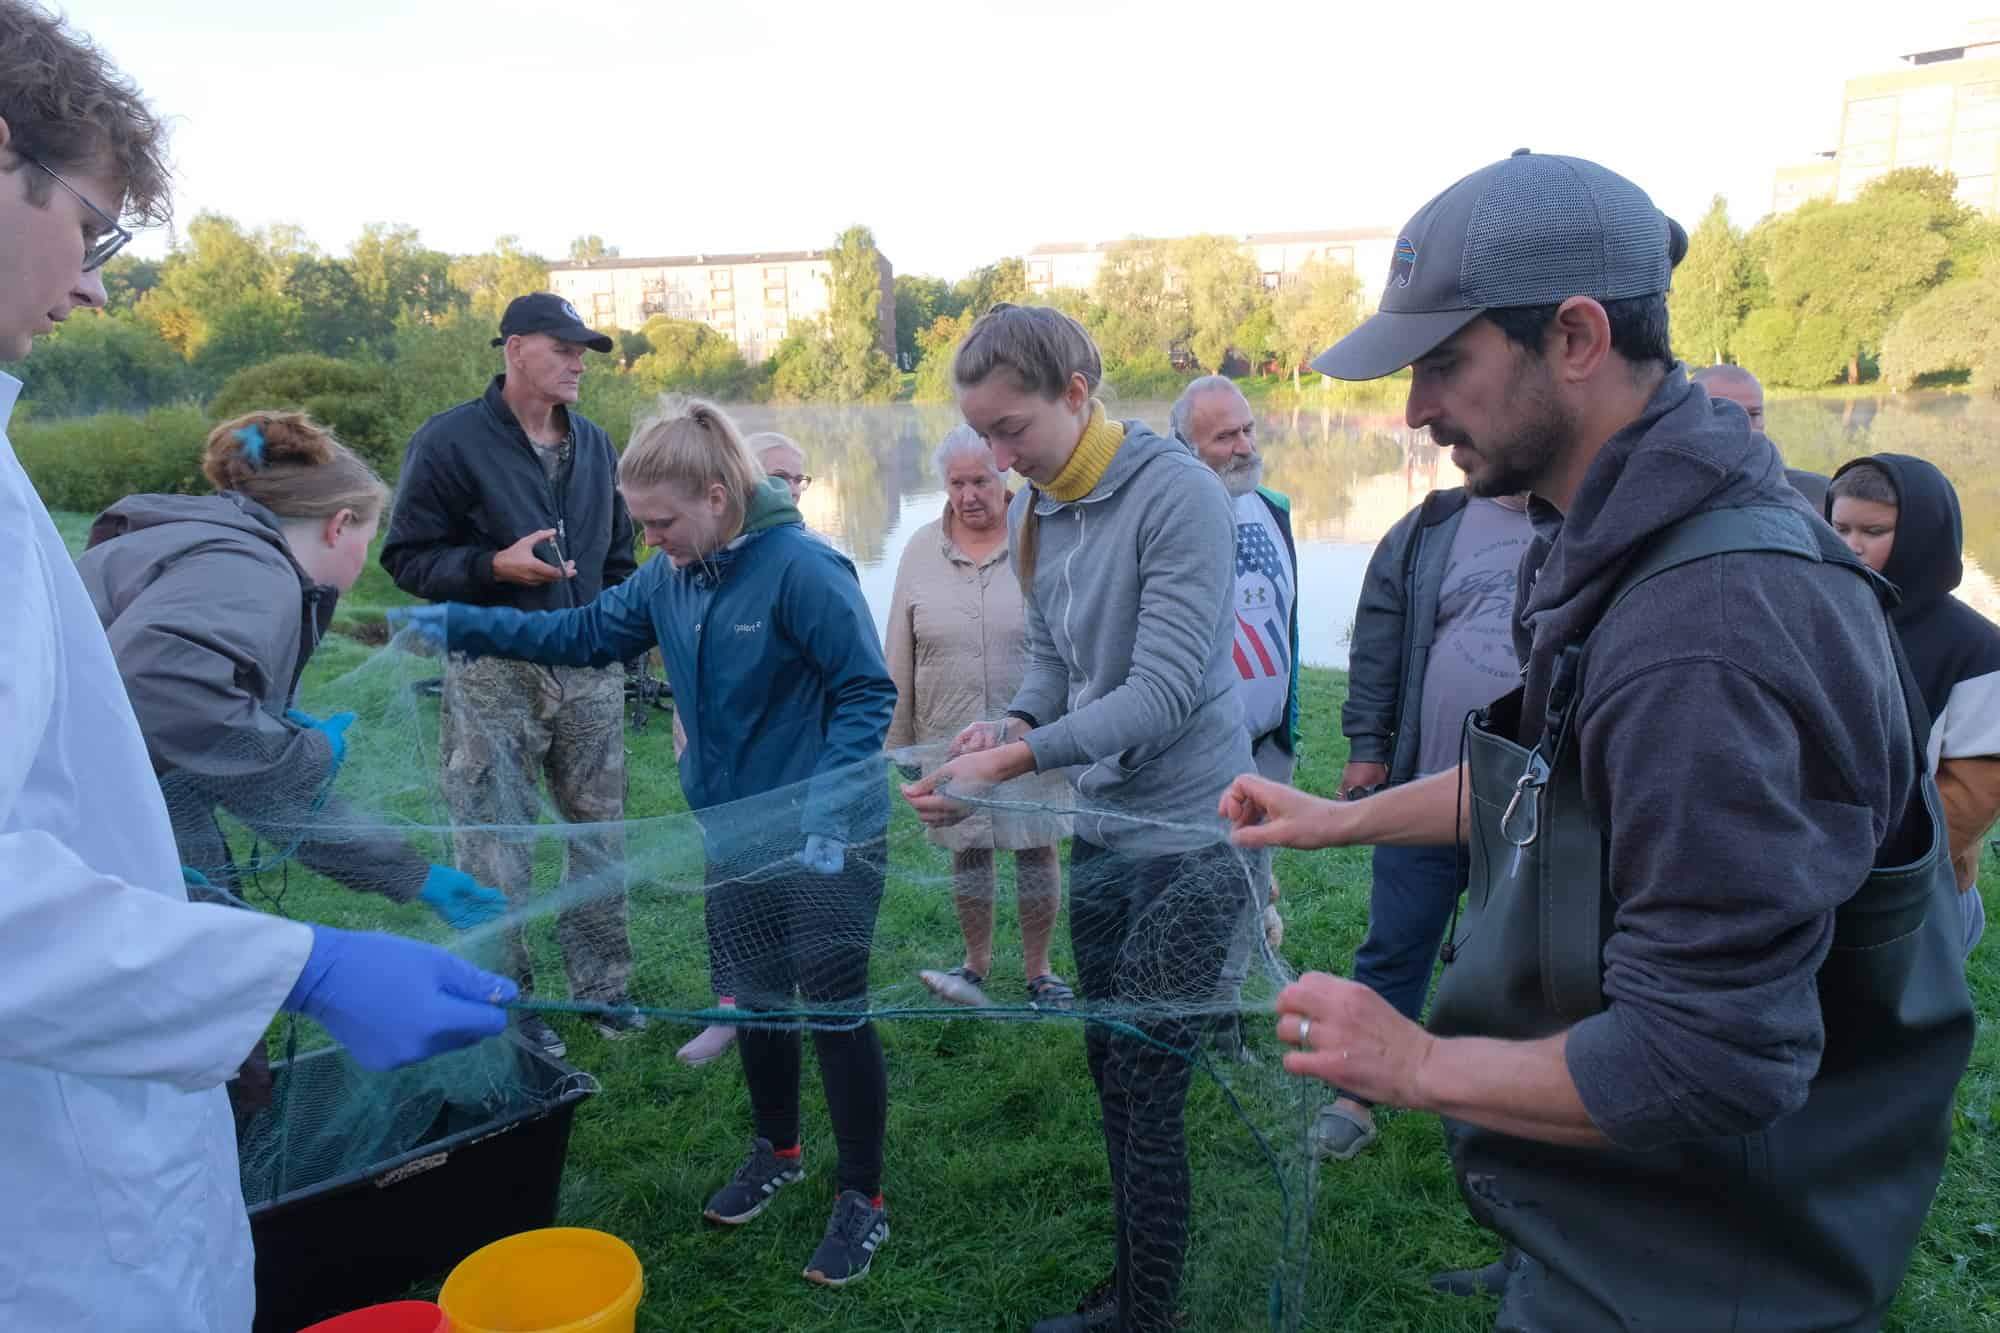
Figure 1 | Fish net removal after a 12-hour long period from Lake Velnezers.
Lower than expected fish catch during the first fish survey at Lake Velnezers
Last autumn, over 80 community members gathered at Lake Velnezers to witness a scientific fish survey, an initiative aimed at assessing and demonstrating the health of the lake’s fish community before the lake treatment. The event, which gained widespread interest, was led by a team of researchers from the Latvian Institute of Aquatic Ecology. As dusk fell, the researchers set out four fishing nets in carefully chosen locations. The nets remained in the water for the next 12 hours, silently doing their work. With the break of dawn, the crowd and national media watched the nets being removed (read more). The catch was modest, just under 3.5 kilograms. However, what raised greater concern was the low number of individual fish. This initial finding already suggested that the fish community of Lake Velnezers may be more depleted than previously assumed.
The catch comprised six fish species native to Latvia: perch, bleak, ruffe, bream, white bream, and roach. Notably, most of the fish were young. For example, the median length of the perch was only 12 cm, indicative of a fish approximately one and a half years old. Low total catch rates were observed across all species, but for bream and perch, exceptionally low catch rates made it difficult to perform meaningful analyses, a result in itself indicative of a struggling fish community.
This visual representation (see Figure 2) explores how a fish’s weight compares to its length. Points above the grey line indicate relatively fat fish and points below the line represent skinny fish. Benthic-feeding species like bream tend to be near an optimal weight, while omnivorous fish like perch and roach are on the thin side. While fish condition is influenced by numerous factors, this could be an indication of a limited forage base. For instance, our diet analyses revealed that Diptera larvae, typically found in the benthic regions of lakes, were frequently observed in the diets of benthic-feeding specialists such as bream but were only encountered once in the diet of a perch. Furthermore, the frequency of empty stomachs was notably higher in perch, with 56% of stomachs found to be empty, compared to benthic-feeding bream, where only 27% were empty, suggesting differences in feeding behavior and prey availability that could be influenced by lake condition.
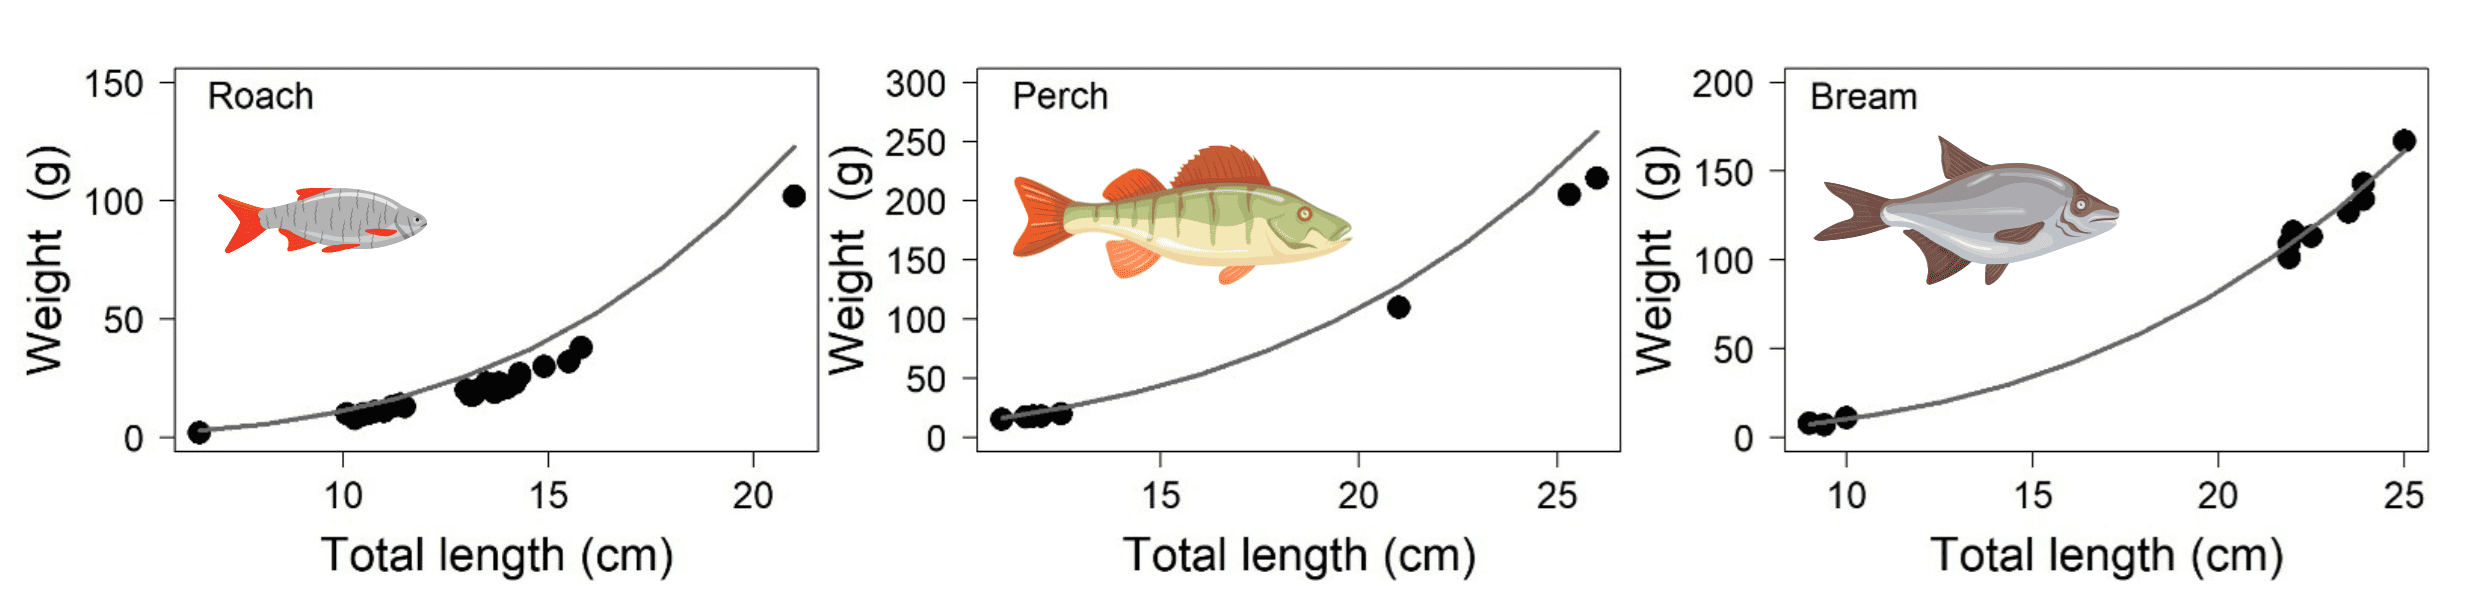
Figure 2 | Fish weight versus total length of perch, bream, and roach caught in Lake Velnezers. The grey line represents the standard weight of fish at a given length for that species. The black dots represent individual fish caught in Lake Velnezers. The standard weight equation for perch was taken from Giannetto et al. (2012) and the equations for bream and roach were calculated from various studies described on the website FishBase (Froese and Pauly 2000).
We observed low catch rates of fish (e.g., perch = 0.16 kg/net) and a low percentage of total catch that was made up of carnivorous fish (8% by count) both of which are characteristic of fish communities that are negatively affected by high phosphorus loads and the subsequent effects of eutrophication (Jeppesen et al. 2000). Notably, the total phosphorus levels in Lake Velnezers are comparable to the upper end of those reported in the referenced study.
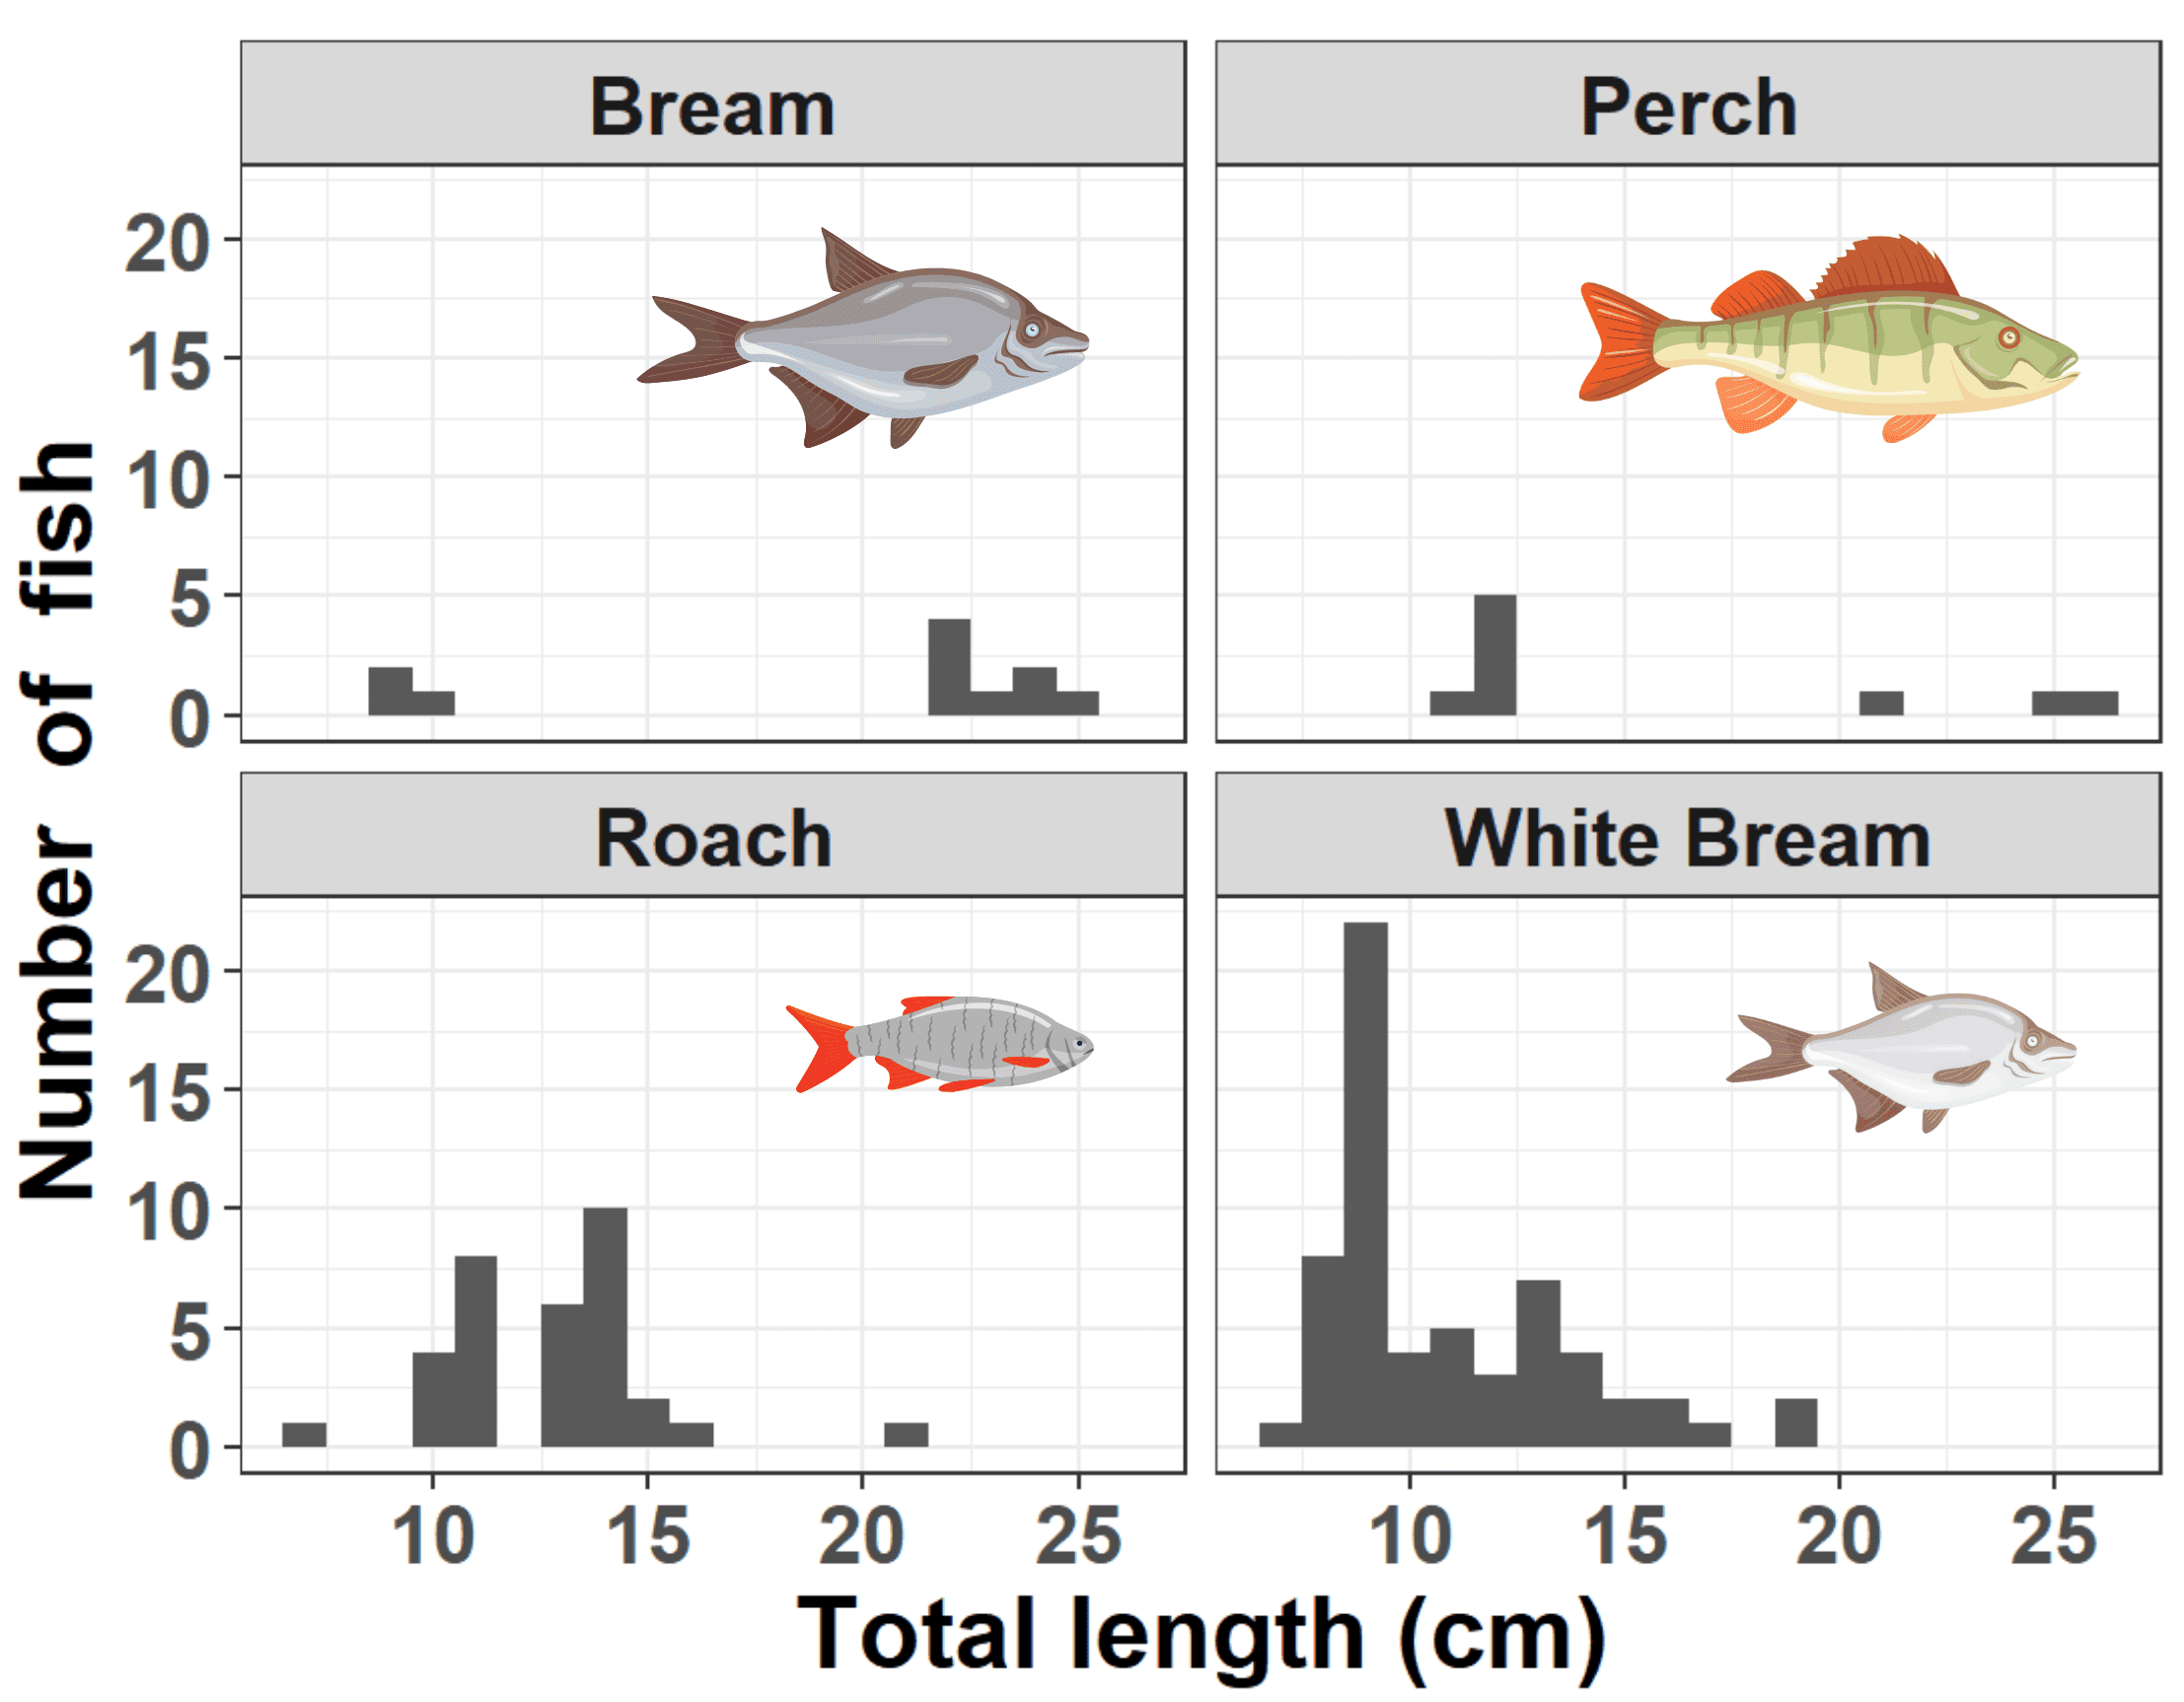
Figure 3 | Fish length distribution by species.
The fish caught spanned various size classes, reflecting different age groups (Figure 3). A typical distribution, as represented by the white bream, would show a prominent peak representing the first-year fish. Subsequently, we might observe one or more peaks around the ages of two and three. However, these peaks tend to fade after the third and fourth years.
Given our low overall catch, our data are not sufficiently large enough to determine if there are any gaps in the age classes. Fish of certain ages may have been subjected to tougher environmental conditions than others, as seen in a recent fish kill event in February 2024 which was mostly comprised of young roaches. However, without more data, we cannot state this for sure. One might ask: if our catch is so low, why not add more nets? Our sampling procedure is based on European standards for freshwater lakes (CEN, 2015), and increasing the sampling effort could risk overfishing the populations.
We also collected samples for assessing fish age, which will become more useful for comparing the growth of fish both before and after the ALUM treatment. For now, we know the oldest fish caught by species were 5 years old for perch and roach, and 4 years old for bream and white bream. While maximum ages of species can vary widely across waterbodies, all these species can live at least twice as long as what we found in Velnezers (Froese and Pauly 2000). However, as standard gill netting protocols do not tend to harvest the largest individuals of many freshwater species, we likely missed older fish.
We found that approximately one-third of the fish stomachs examined were empty. The diet of these fish primarily consisted of small invertebrates found near the shore, including zooplankton, insects, and larvae. Interestingly, only one instance of fish predation was observed, with a single fish found in the stomach of a perch.
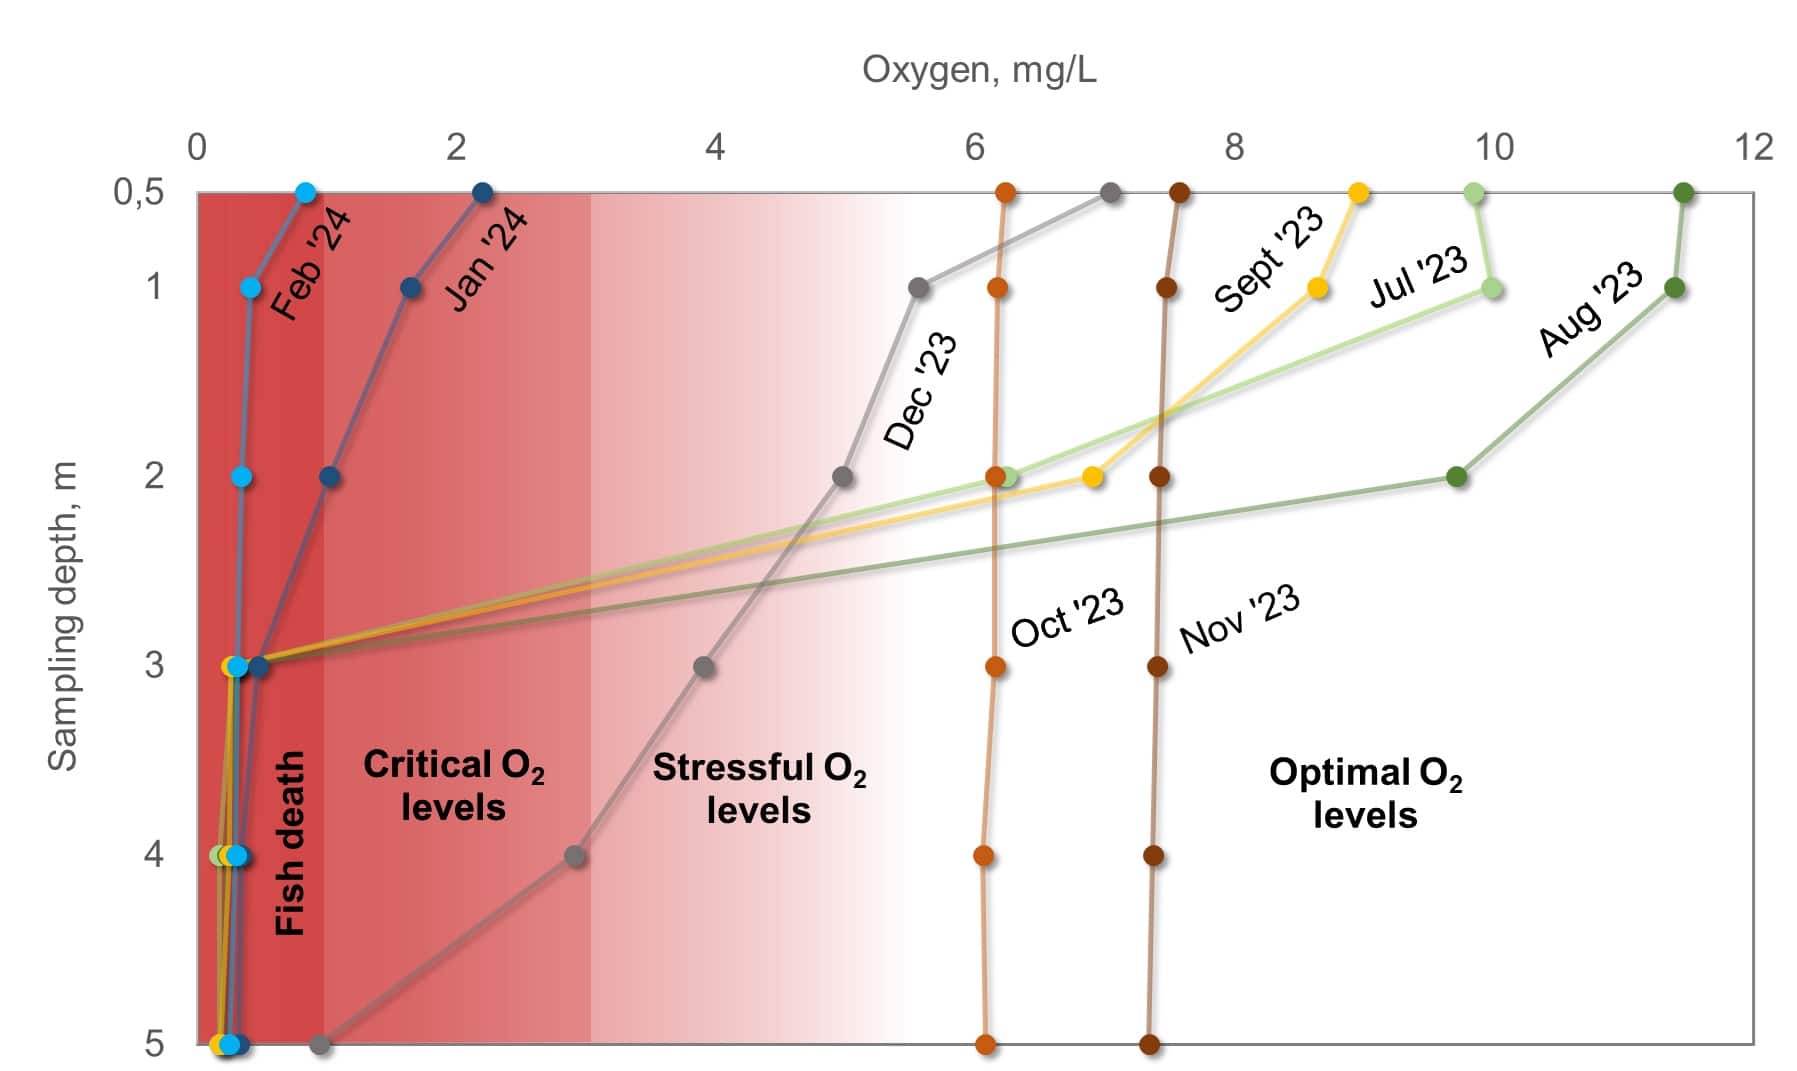
Figure 4 | Oxygen monitoring in Lake Velnezers reveals unfavorable conditions for fish communities during summer (low oxygen below 2 meters depth) and winter (oxygen levels become critical across the whole lake).
The low oxygen levels that we observed in the deeper layers of the lake (below the top 2 meters) throughout the summer months likely had an impact on the fish we caught in early autumn. These low oxygen levels may have forced the fish to only occupy the surface waters of the lake where warm water temperatures may stress their metabolic systems and lead to skinnier fish, particularly noticeable in the case of the perch. Read more about oxygen level monitoring and recent fish kills in February here.
Step by step laboratory journey
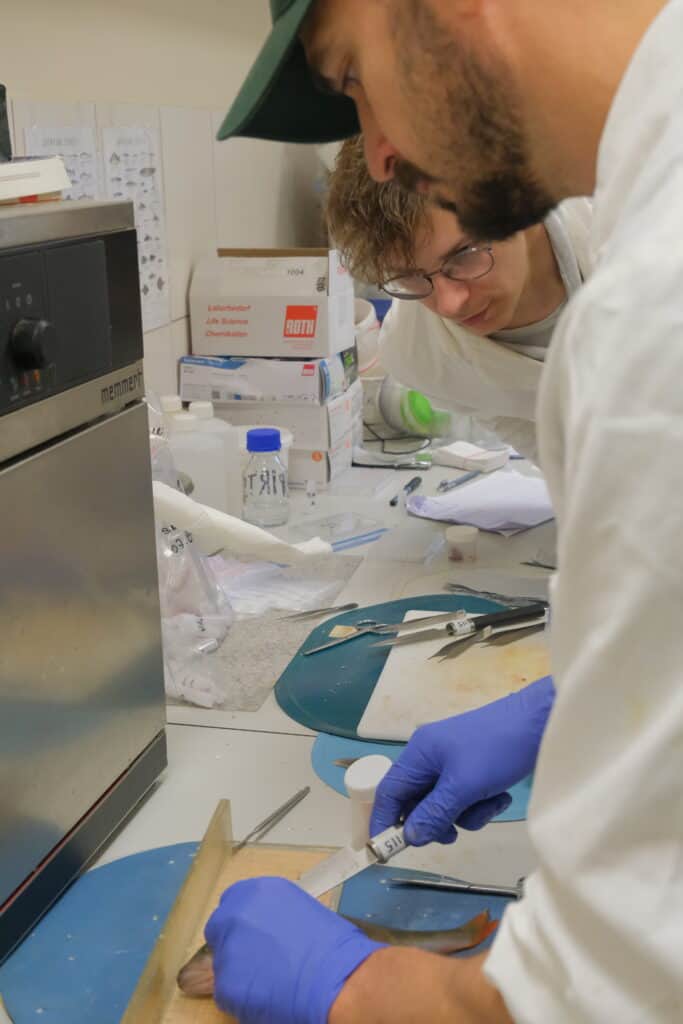
Figure 5 | Experts Juris Tunens and Nick Heredia from the Latvian Institute of Aquatic Ecology
First of all, we measured the length (Figure 6) and weight (Figure 7) of each fish. These data along with the total catch will be used to compare fish populations before (this survey) and post-treatment (planned survey next year).
We removed the stomachs to assess the fish diet (Figure 8). Stomach contents give a snap-shot view of what the fish have eaten in the last day or so. Diet is one thing we would expect to change after the lake treatment.
We collected tissue samples (Figure 9) to measure the amounts of aluminum before the treatment and will do the same in the next fish survey after the treatment. It is done to demonstrate the ALUM method’s safety, and to assure the public that aluminum levels in fish tissues was similar both before and after treatment.
We collected structures for aging fish (Figure 10). Aging the fish can be used to calculate the average size per age, the size structure of the populations (i.e., the balance between young and old fish), and growth rates. All of which can be used to assess how fast fish are growing. We collected scales, operculums (a flattish bone that covers the gills), cleithrums (kind of a jawbone), and otoliths (ear bones that aid with balance and movement), which can all be used for aging fish.
References:
- CEN, 2015. Water Quality – Sampling of Fish With Multimesh Gillnets. European Standard. European Committee for standardization. Ref. No. EN 14757: 2015.
- Froese, R., and D. Pauly, Editors. 2000. FishBase 2000: concepts, design and data sources. ICLARM, Los Baños, Laguna, Philippines. 344 p.
- Giannetto, D., A. Carosi, E. Franchi, G. La Porta, and M. Lorenzoni. 2012. Proposed standard weight (Ws) equation for European perch (Perca fluviatilis Linnaeus, 1758). Journal of Applied Ichthyology. 28(1): 34-39.
- Jeppesen, E., J.P. Jensen, M. Sondergaard, T. Lauridsen, and F. Landkildehus. 2000. Trophic structure, species richness and biodiversity in Danish lakes: changes along a phosphorus gradient. Freshwater Biology. 45: 201-218.
- Studies used for the calculation of standard weight for bream Abramis brama (FishBase
Ref. #): 27610, 41823, 59105, 88166, 121682, 129172. - Studies used for the calculation of standard weight for roach Rutilus rutilus (FishBase Ref.
#): 27610, 50932, 56502, 59097, 59105, 71904, 88163, 88165, 88166, 95340, 121682.
The article was prepared by scientific assistant Nicholas Heredia and communication manager Inga Retike from the Latvian Institute of Aquatic Ecology.


Additional links
details
-
Homepage
-
Project typeSmall Project

-
ImplementationAugust 2023 - July 2025
-
StatusCompleted
-
Contribution to EUSBSRPolicy Area Nutri

-
Target groups
- Local public authority
- National public authority
- Regional public authority
-
Social media
-
Additional links
-
Tags