

It’s out in the world – APRIORA plugin officially released!
03 July 2026
The official QGIS repository has formally welcomed a powerful new tool for regional and local authorities and sectoral agencies: the APRIORA plugin (Fig. 1).
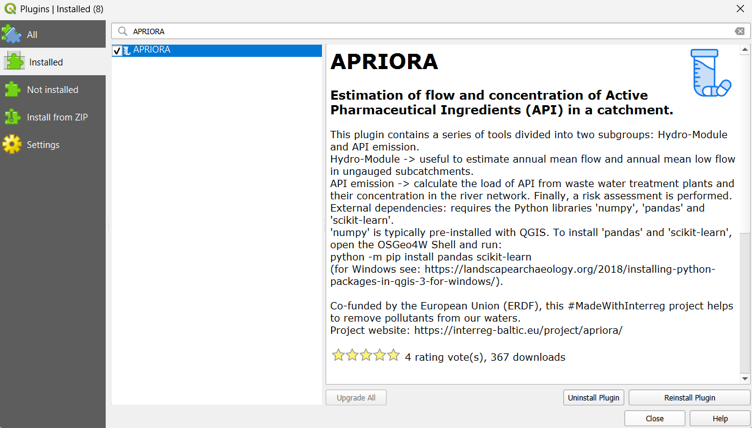
Figure 1. APRIORA plugin in the official QGIS repository
This open-source tool is divided into two main components: one predicts average and low river flows within a catchment, while the other estimates the concentration of pharmaceuticals in water bodies to perform comprehensive environmental (ERA), antimicrobial resistance (AMR-RA) and human health (HHRA) risk assessments.
Useful links:
The challenge: regulatory gaps & micropollutants
Pharmaceuticals discharged from wastewater treatment plants (WWTPs) pose a growing risk to aquatic ecosystems. To address this, the EU Urban Wastewater Treatment Directive (UWWTD) mandates advanced “quaternary” treatment for large WWTPs (>150,000 PE) and requires a risk-based prioritization for mid-sized plants (10,000–150,000 PE) by 2045. However, a major implementation gap remains: the UWWTD lacks a unified risk assessment methodology. Additionally, smaller WWTPs (<10,000 PE) are often excluded from direct regulations, despite their cumulative impact on vulnerable, low-flow waters and a severe lack of monitoring data.
To bridge this gap, the APRIORA project developed a QGIS plugin that models annual pharmaceutical loads using national or regional sales data. Piloted across five countries (Germany, Finland, Latvia, Poland, and Sweden), its key features include:
- Data integration: incorporates substance-specific excretion and removal rates from literature or monitoring data
- Flow modelling: estimates river concentrations by pairing point-source emissions with flow data, which can either be imported or simulated using the plugin’s built-in hydrological model
- Risk mapping: quantifies risk quotients to identify critical areas and compare current conditions against potential mitigation strategies
Beyond pharmaceuticals, this approach is highly transferable to other critical substances where point-source emissions can be quantified, such as industrial PFAS.
Case studies in action
The tool’s practical value can already be seen in different catchments across the Baltic Sea region. APRIORA has generated high-resolution risk maps for catchments in Germany (Fig. 2), Poland (Fig. 3) and Latvia (Fig. 4). These maps visually pinpoint specific river sections under ecological stress from Diclofenac, allowing regional authorities to instantly see where intervention is needed most and test the effectiveness of potential upgrades before investing resources.
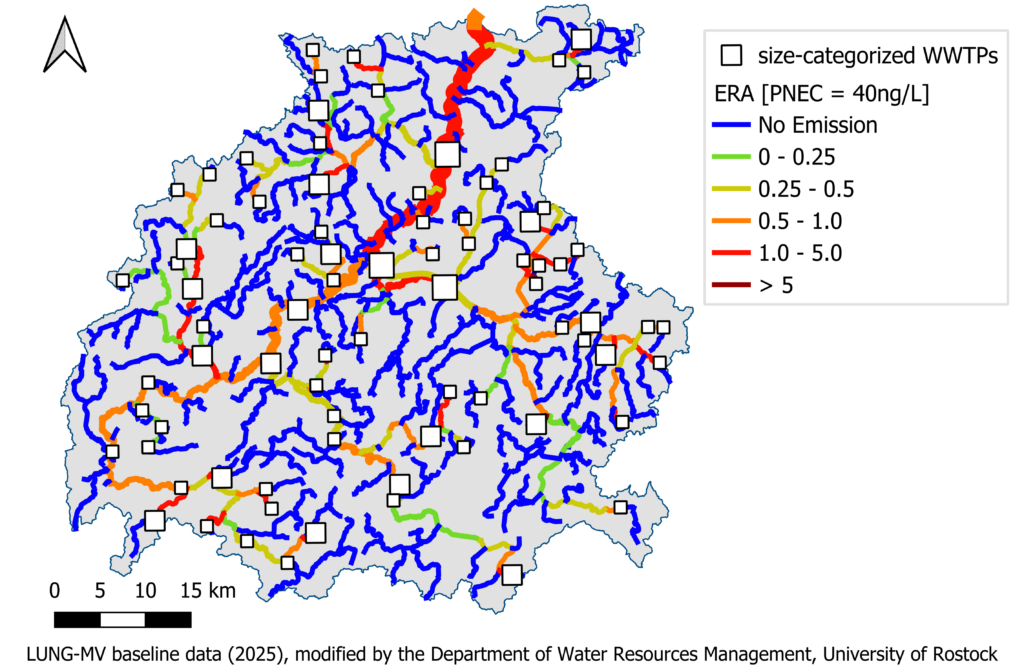
Figure 2. ERA risk map of Diclofenac in the Warnow catchment (DE)
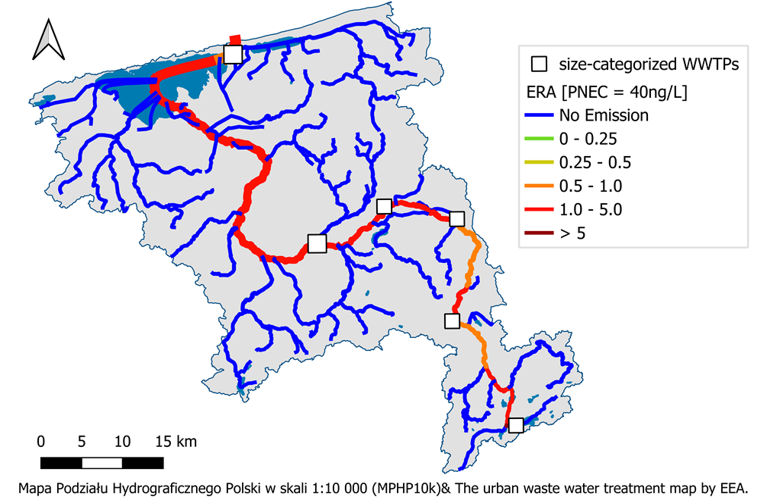
Figure 3. ERA risk map of Diclofenac in the Łeba catchment (PL)
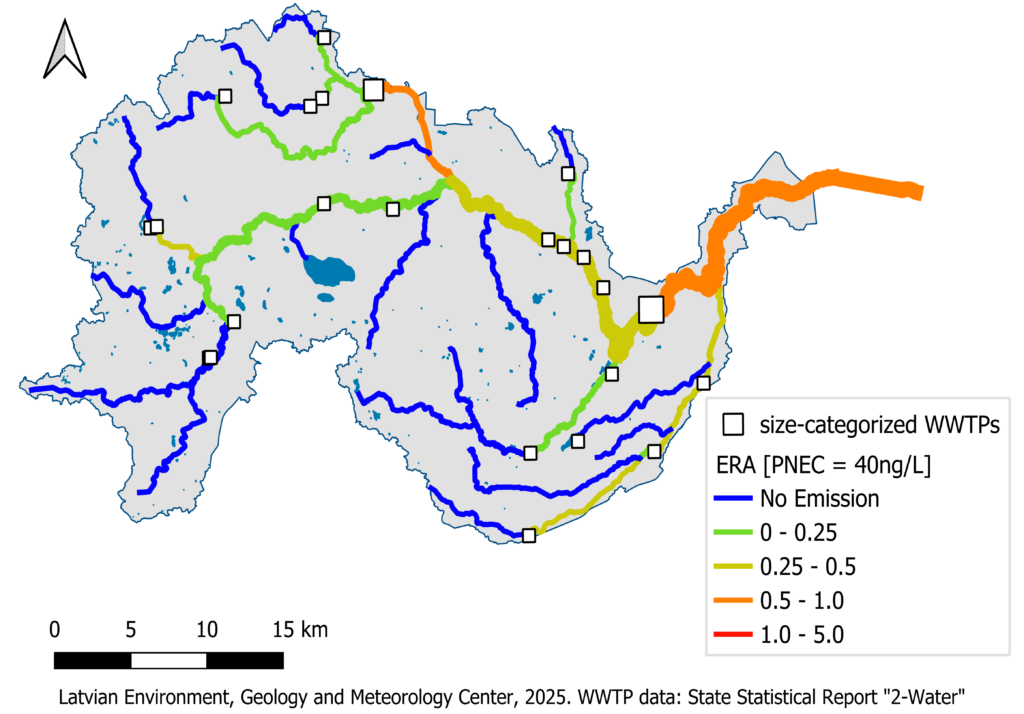
Figure 4. ERA risk map of Diclofenac in the Bērze catchment (LV)
Would you like to have a high-resolution risk map for your catchment, too? Try it out yourself! Download the APRIORA plugin today from the official QGIS repository and start mapping.

details
-
Homepage
-
Project typeCore Project

-
ImplementationNovember 2023 - October 2026
-
StatusOngoing
-
Contribution to EUSBSRPolicy Area Hazards

-
Target groups
- Infrastructure and public service provider
- Sectoral agency
-
Social media
-
Additional links
-
Tags