



Piloting in Germany
28 April 2026
APRIORA becomes practical – goal of piloting the approach:
To make sure our developed solution works well, we were testing the approach in five river catchments across the Baltic Sea Region countries Finland, Germany, Latvia, Poland and Sweden. This included all three modules from monitoring, modelling and risk assessment as well as learning and teaching how to apply the QGIS tool. Regional authorities in charge took care of the piloting, working alongside scientific experts to ensure the solution meets their actual needs.
Piloting in Germany – this is their story
Assessing pharmaceutical pollution risks in the Warnow river basin
Catchment background
As part of the APRIORA project, this pilot study evaluates pharmaceutical pollution risks within the Warnow river basin, a critical lowland catchment in northeast Germany that provides drinking water to over 250,000 consumers. Thanks to a strong regional stakeholder collaboration and a mass-flow modelling tool, high-resolution risk maps were produced, successfully identifying pollution hotspots and demonstrating that even small wastewater treatment plants must be integrated into long-term strategic river management and mitigation planning.
Catchment description
The Warnow is a characteristic lowland river in northeastern Germany with a 3,324 km² basin and many tributaries (Figure 1). Wastewater in the rural area is treated by over 80 wastewater treatment plants (WWTP), only a few of them with a design capacity above 10,000 PE. A controlled underflow weir separates the freshwater upper Warnow from the brackish lower estuary. Just upstream of this weir lies the raw water abstraction point supplying about 250,000 people in Rostock and nearby communities. Besides its importance for drinking water, the basin hosts valuable freshwater ecosystems, making chemical pollution risks a key concern.
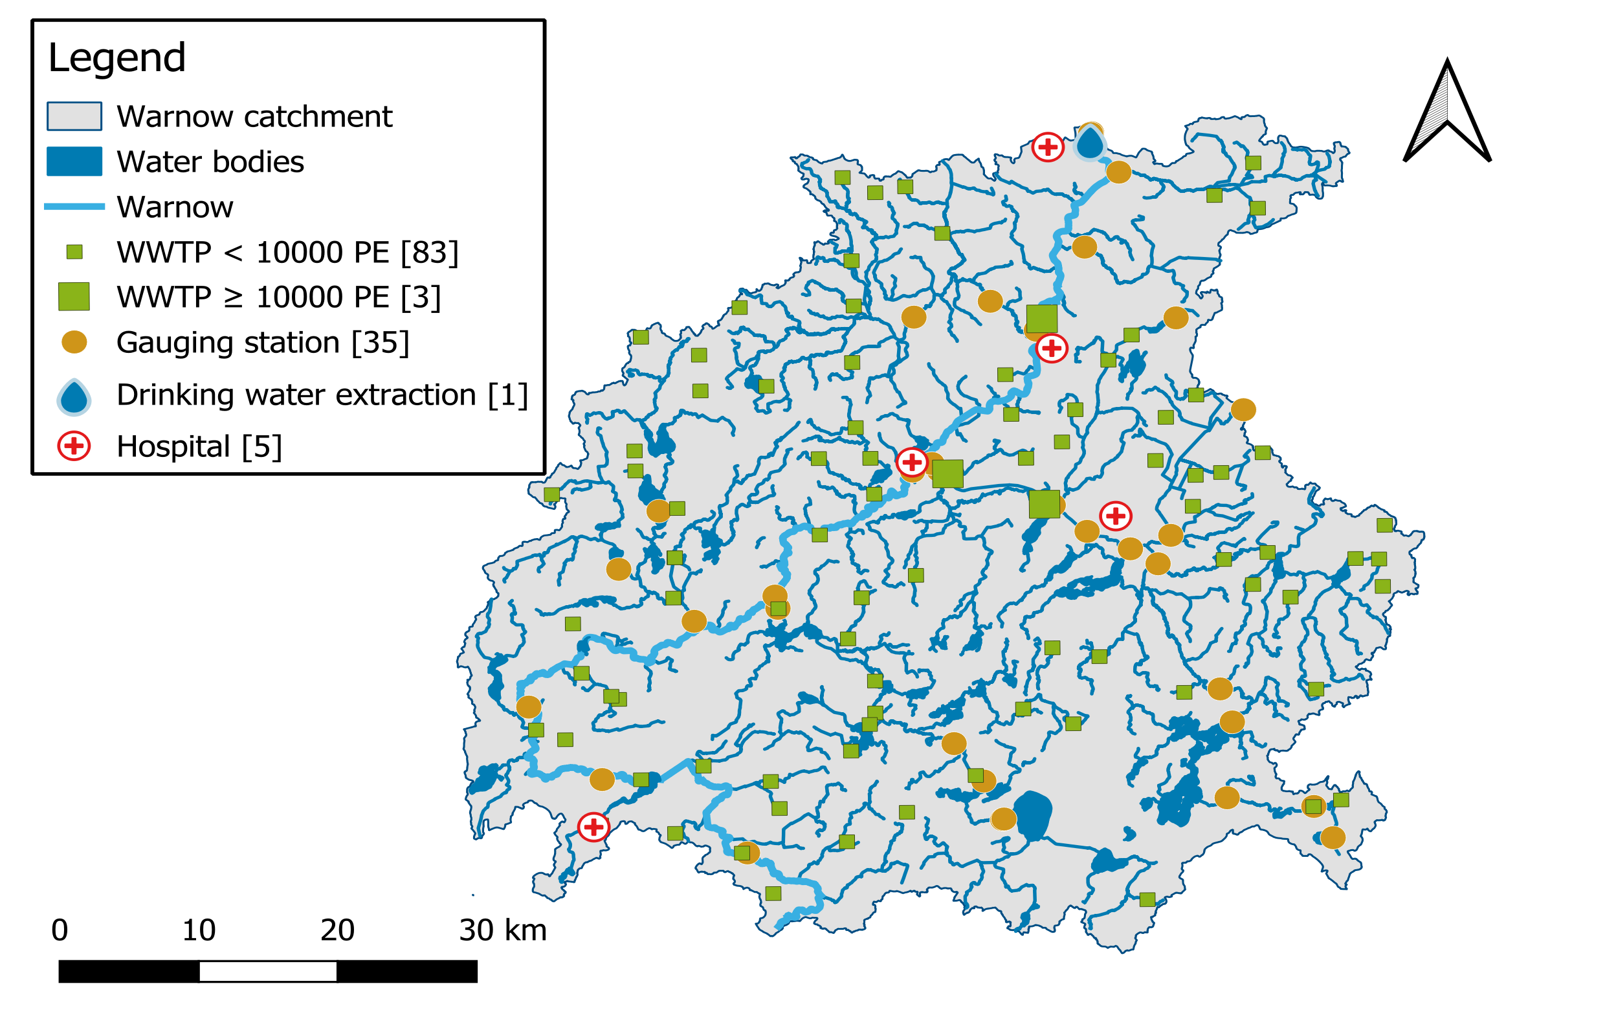
Figure 1. Map of the Warnow river catchment.
Preparation and cooperation with regional stakeholders, authorities, and target groups
The piloting war prepared in close coordination with responsible authorities and WWTP operators. During the monitoring campaigns, additional organisations joined, showing strong regional interest in pharmaceutical risk assessment. Collecting flow data across four campaigns was demanding, but collaboration with regional departments using similar flow monitoring tools (ADCP-based technique) enabled data exchange, cross‑checking and integration of high‑quality measurements. WWTP operators and authorities also provided up-to-date information on connected inhabitants, treatment technology, hydrology and geodata needed for model parametrisation.
Challenges in chemical analysis of water and wastewater samples
One major challenge in the German pilot project was the chemical analysis of the samples. Following the initial sampling, it became clear that the contracted laboratory was unable to guarantee sufficiently low limits of quantification, particularly for the low concentrations found in the river samples. Fortunately, our project partner SYKE, which had already carried out the laboratory analyses as part of the Finnish pilot project, was willing to step in, and we were able to agree on a smooth redistribution of the workload and the associated budget within the consortium. Finally, we obtained a valuable data set to calibrate and validate the mass-flow model throughout the entire model chain.
Estimating pharmaceutical concentrations – using outdated flow data/update data sources
Pharmaceutical emissions of individual WWTPs were derived from statistical consumption data using two synergistic datasets: national sales data from IQVIA company, which are available for all partner countries, and regional prescription data from WIDO, a scientific data service of German compulsory health insurances.
By intersecting both sources of information, we were able to calculate regional specific average annual per capita consumption figures for the substances under investigation. In combination with the detailed information on real connected inhabitants and literature based excretion and removal rates, we were able to estimate reliably inflow and discharge loads for all WWTPs, even for the small ones. The rate estimations could be calibrated in a second step based on monitoring data. Calculating spatially high resolution river flow data was favoured by the existence of regionalised area specific data. However, this favourable situation cannot be assumed to apply to other regions in the Baltic. Therefore, the initial statistical regionalisation approach based on geodata and gauging data was carefully studied and transposed in a generally applicable AI supported approach, based on Baltic wide accessible geodata.
The modelling results obtained were in good agreement with the monitoring data, which shows that even this fairly robust approach can yield reliable results, provided the input data has been carefully compiled. In the following figures it is possible to see the comparison between measured and modelled pharmaceutical load at WWTP influent and effluent (Figure 2) and at the river sections (Figure 3).
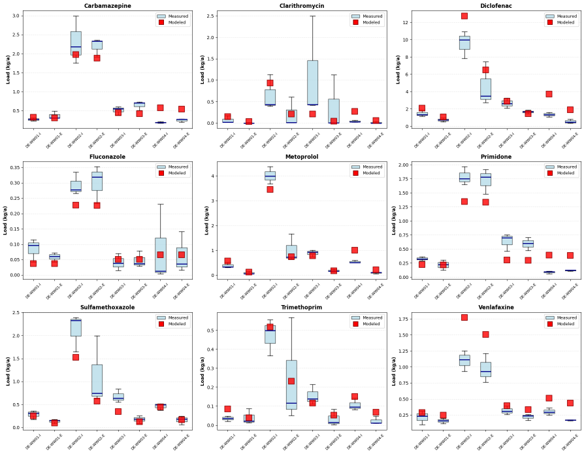
Figure 2. Pharmaceutical load comparison at WWTP influent and effluent.
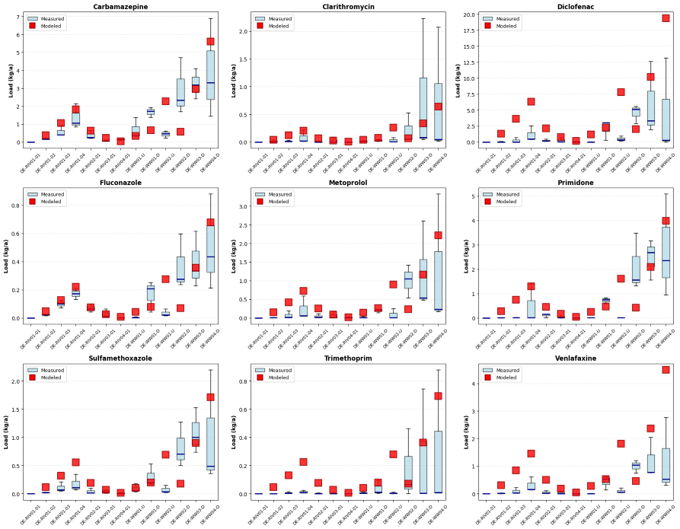
Figure 3. Pharmaceutical load comparison at 13 different river sections.
As a result, a differentiated risk assessment was carried out by active substance and protection criterion. Sewage treatment works posing a pollution risk were identified. Although the three larger WWTPs in river basin had the greatest impact, it became evident that also numerous small plants are responsible for increased environmental risks, in particular when discharging in river sections with low flow. Various mitigation scenarios have been modelled, which show that measures at WWTP with a population equivalent of less than 10,000 should also be taken into account for a strategic river management. An example of this is illustrated in Figure 4: the map on the right displays a risk map related to the environmental risk assessment (ERA) of Diclofenac calculated based on the status quo, while the zoomed panel on the left shows how the situation would change if the three largest WWTPs were upgraded to a quaternary treatment stage. Although a visible improvement in the risk classification is achieved for the main river, all upstream river sections not connected to these three WWTPs continue to contribute to identified risk conditions in various river sections.
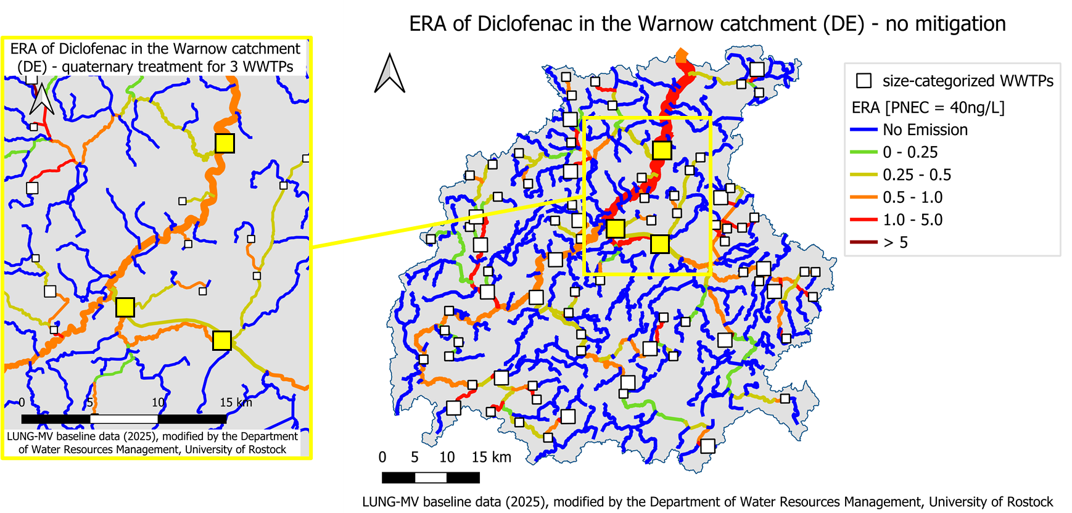
Figure 4. Diclofenac environmental risk map comparing the status quo (right) with the mitigation scenario (left).
Teach-the-teacher from tool developer to partners – benefits of teaming up before transfer
Leading the Teach-the-Teacher (TTT) sessions provided a highly valuable beta-testing environment from a developer’s perspective. This format transformed the partner group into a safe testing ground, offering instant feedback and direct observations of how the users interact with the tool. That allowed for the identification of bugs and usability challenges well ahead of the official release in the QGIS repository. The in-person meetings not only facilitated immediate troubleshooting, but also created a strong team bond and pushed the developer to generate comprehensive support materials like manuals and exercises. Finally, the practical insights, feature suggestions and general feedback provided by the partners were documented and implemented. This collaborative refinement process directly shaped the final tool and helped its development. All the changes can be publicly tracked via the GitHub repositor.

Interactive map showing pilot locations. Use the arrow keys to move the map view and the zoom controls to zoom in or out. Press the Tab key to navigate between markers. Press Enter or click a marker to view pilot project details.
details
-
Homepage
-
Project typeCore Project
-
ImplementationNovember 2023 - October 2026
-
StatusOngoing
-
Contribution to EUSBSRPolicy Area Hazards

-
Target groups
- Infrastructure and public service provider
- Sectoral agency
-
Social media
-
Additional links
-
Tags