



Piloting in Finland
28 April 2026
APRIORA becomes practical – goal of piloting the approach:
To make sure our developed solution works well, we were testing the approach in five river catchments across the Baltic Sea Region countries Finland, Germany, Latvia, Poland and Sweden. This included all three modules from monitoring, modelling and risk assessment as well as learning and teaching how to apply the QGIS tool. Regional authorities in charge took care of the piloting, working alongside scientific experts to ensure the solution meets their actual needs.
Piloting in Finland – this is their story
Monitoring pharmaceuticals in the Kyrönjoki river basin
General introduction into the approach and piloting
Pharmaceuticals are continuously released into aquatic environments through municipal wastewater treatment plants (WWTPs). Discharges have been mostly studied in urban areas, whereas less densely populated regions have often remained unmonitored. However, some small WWTPs discharge into receiving waters with limited dilution capacity. Even in favorable dilution conditions, the cumulative load from several facilities can still lead to elevated pharmaceutical concentrations in downstream water bodies. Therefore, identifying WWTPs with the greatest potential for reducing the load is vital. Finnish piloting addresses these questions and identifies other specific features in the catchment area.
Overview of the pilot area
Piloting was carried out by project partners SYKE and LVV in collaboration with project associated organisations (AO). The selected Finnish pilot area, the Kyrönjoki river basin, is located in western Finland. The catchment is characterised by flat topography and a relatively low level of urbanisation. Six municipal WWTPs discharge into the river system, collectively serving approximately 90,000 inhabitants. The largest WWTP, located in Seinäjoki, accounts for more than 60% of the total connected population and is therefore the dominant point source.
Catchment area description
The main channel of the Kyrönjoki river is approximately 130 km long, and the catchment area covers 4,923 km². Wastewater samples were collected from six WWTPs (Ilmajoki, Jalasjärvi, Kauhajoki, Kurikka, Seinäjoki, and Vähäkyrö) with capacities ranging from 9,200 to 112,000 PE, all applying similar treatment processes. Surface water samples were taken from 19 locations across the basin (Figure 1).
Flow data were obtained from fifteen gauging stations, but importantly, also compiled from the Finnish national WSFS-VEMALA flow model. The model accounts for key hydrological drivers such as air temperature, precipitation, snow accumulation and melt, evaporation, and catchment characteristics. Measured flows from the gauging stations showed strong correlation with VEMALA‑simulated flows, supporting the use of VEMALA data in the pilot. A clear future advantage of using the VEMALA flow model is that it is also available for all other catchments in Finland. Moreover, VEMALA model works as a shortcut by replacing flow estimation tool in the QGIS plugin developed in the project. Alternatively, it can also be used as validation between the two modeling approaches.
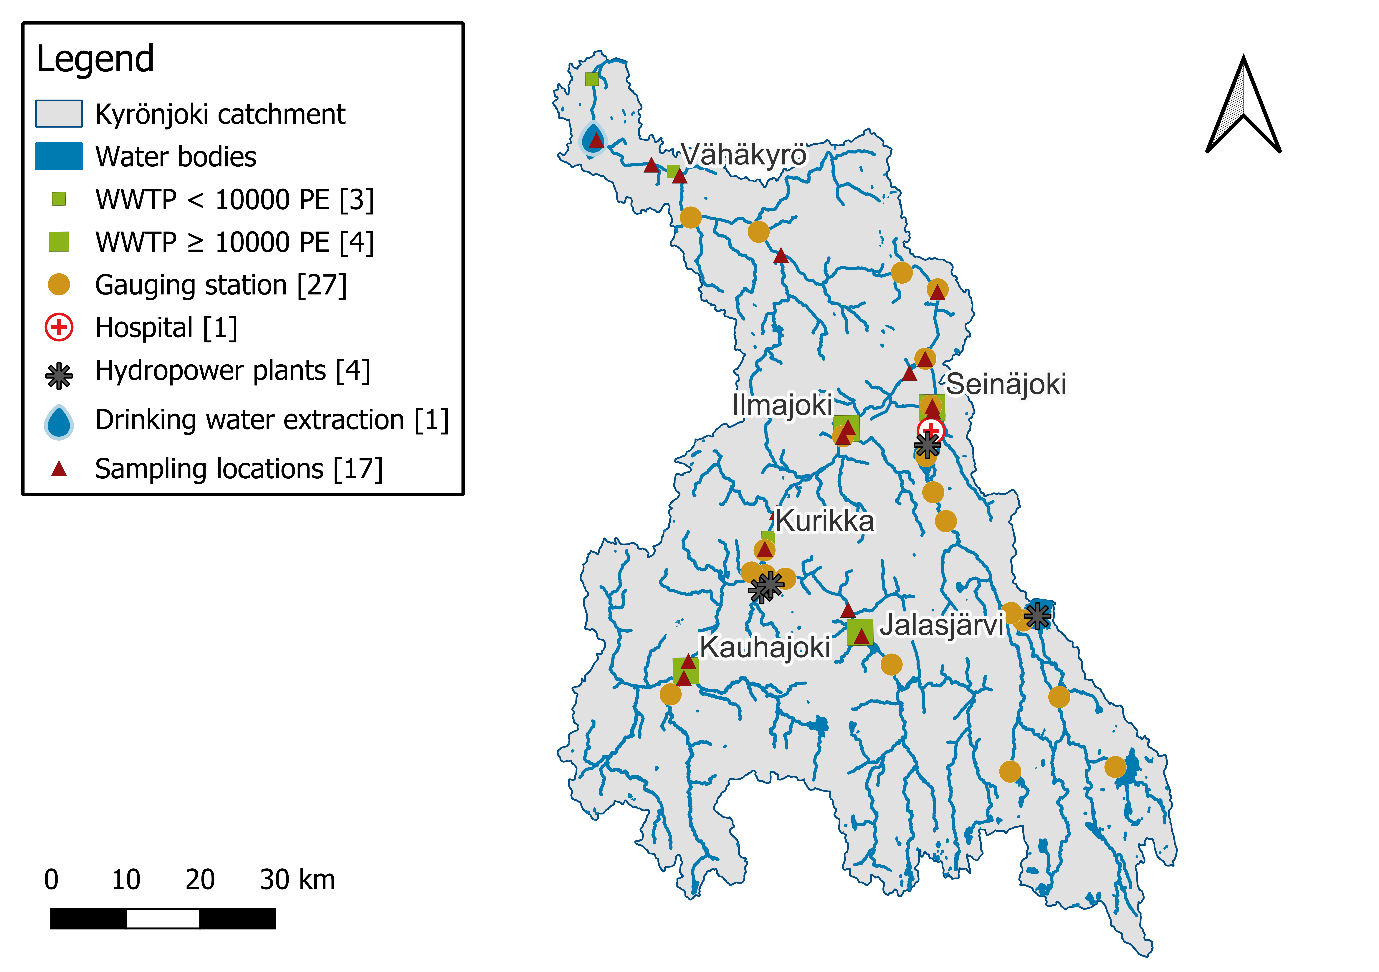
Figure 1. Map of Kyrönjoki river catchment area with sampling point locations and other spatial information.
Sampling procedure
Sampling was conducted on four occasions: 20 November 2024, 18 February 2025, 21 May 2025 and 5 August 2025. The lowest flow was observed during the August sampling round. Sampling was performed by the environmental consultant company (KVVY Tutkimus Oy), carried out by accredited experts. Surface water samples were collected upstream and downstream of the WWTPs and from river junctions as grab samples (Figures 2a and 2b). Wastewater samples were collected as 24-hour flow-proportional composite samples from influent and effluent streams (Figure 2c). All samples were frozen and sent to the laboratory for analysis.
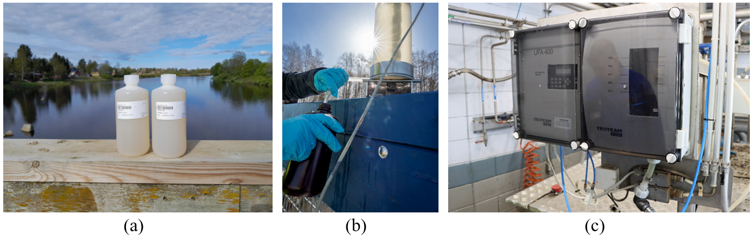
Figure 2. Surface water and wastewater sampling. 2a, 2b (photo by O. Leino), and 2c (photo by E. Alho).
Chemical analysis
Ten different pharmaceuticals were selected for monitoring. Prior to analysis, frozen water samples were melted, weighed, purified and concentrated. Internal standards were added to all samples, as well as quality controls and blanks. All samples were centrifuged to remove solid particles, and wastewater samples were further filtrated prior to analysis by chromatography and mass spectrometer (LC-MS/MS) (Figure 3). In addition to Finnish samples, SYKE laboratory also analysed samples from Germany.
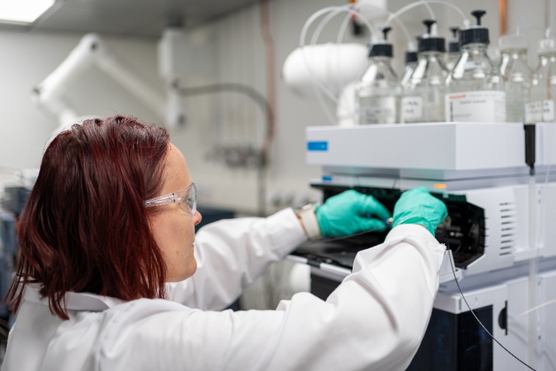
Figure 3. Chemical analysis at the laboratory, photo by O. Leino.
Wastewater results
There was considerable variation in removal rates between the WWTPs, the selected pharmaceuticals, and the different sampling seasons (Figure 4). Notably, in almost every case the required 80% removal efficiency set by the new EU Urban Wastewater Treatment Directive was not achieved.
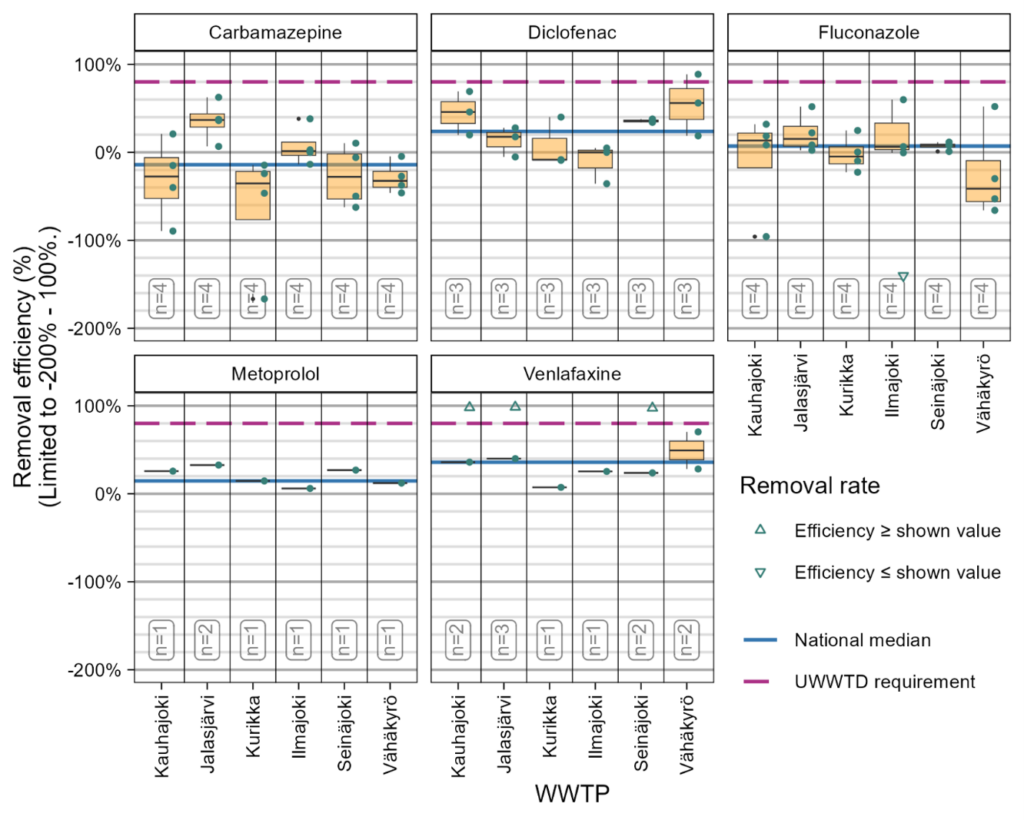
Figure 4. Variability in the removal rates of the WWTPs
Four selected indicator active pharmaceutical ingredients (API) in the piloting were carbamazepine, diclofenac, metoprolol and venlafaxine. Diclofenac and venlafaxine wastewater concentrations clearly exceeded EQS levels in all six WWTPs (Figure 5).
Surface water results
The API with the highest mean concentrations was diclofenac. The locations showing the highest concentrations varied between sampling rounds. Occasional exceedances of EQS/PNEC values were observed only for diclofenac and venlafaxine. For some APIs, such as venlafaxine and metoprolol, there was an increasing time trend from high flow season (November) towards dry season (August). Concentrations downstream from WWTPs were clearly higher than upstream (Figure 5).
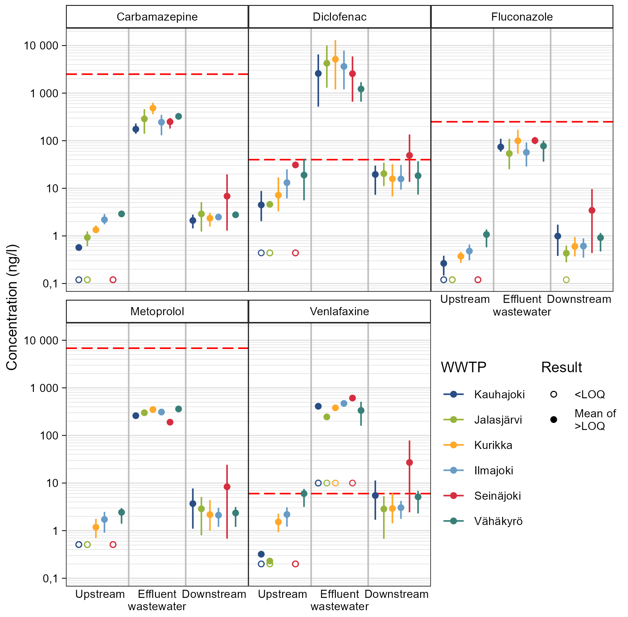
Figure 5. Concentrations of selected APIs in effluent (panel in the middle), and surface water concentration up/down from WWTPs (left and right panels). Red dashed line denotes to EQS threshold.
Modeling emission loads and risk assessment
Finnish API consumption data was used to calculate emission loads from the wastewater treatment plants. The estimations were based on wholesale numbers reported to the Finnish Medicines Agency in 2023. The sales are national, not pinpointed to the pilot area. Wholesale numbers may overestimate the actual consumption, so the modeling results can be considered as a worst-case scenario. Using the QGIS plugin developed in the project, we were able to locate a short river section after discharge from Seinäjoki WWTP where both diclofenac and venlafaxine environmental risks were clearly elevated (Figure 6). This shows the potential of the modeling tool to prioritise WWTPs in the river network. Human health risks and antimicrobial risks were found negligible.
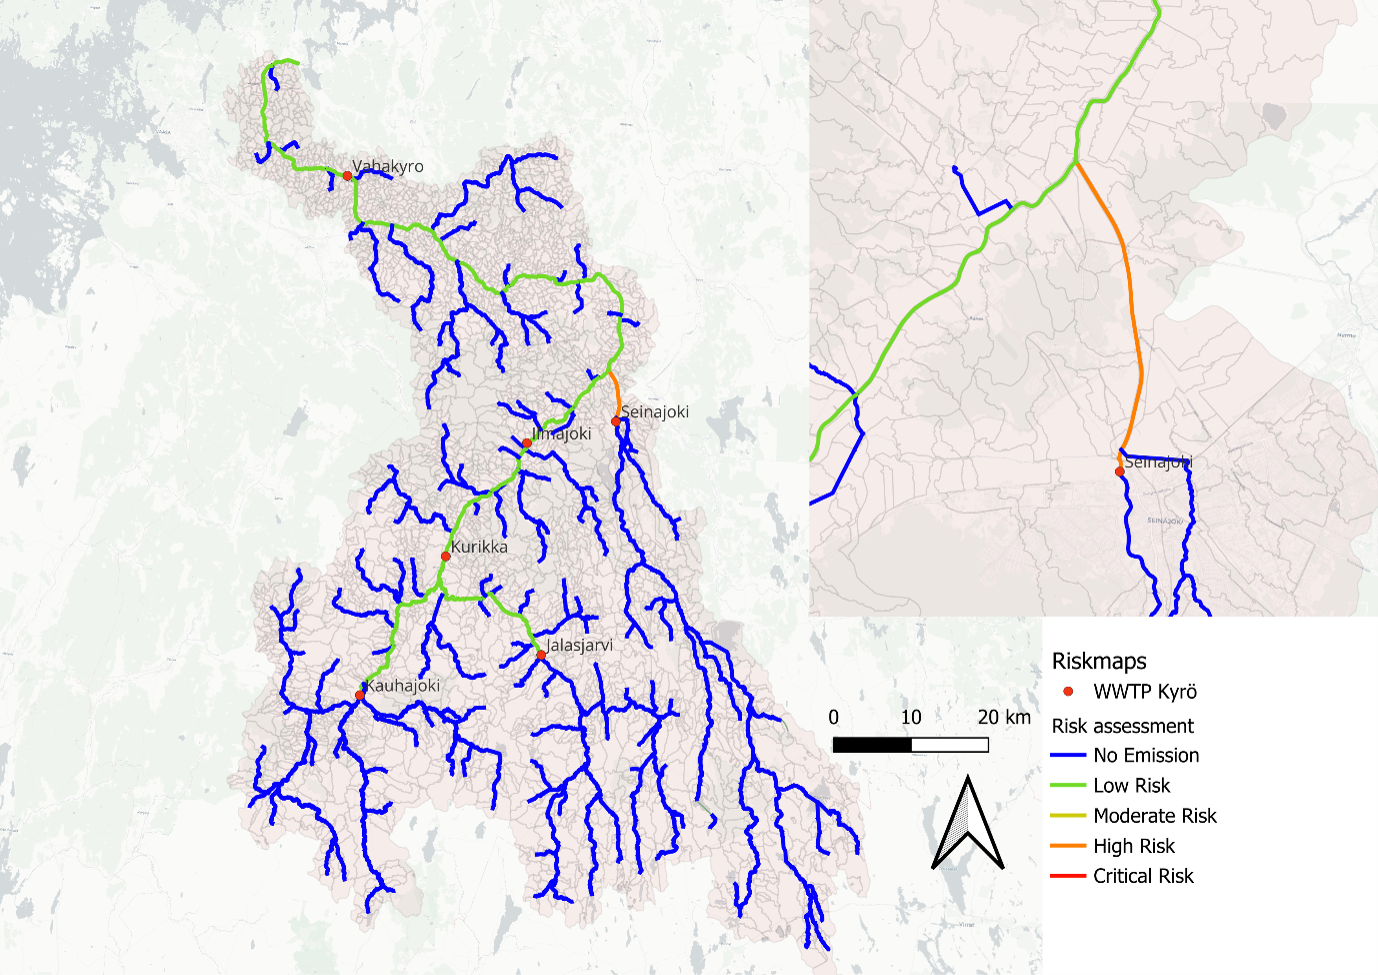
Figure 6. Environmental risk map of diclofenac in the catchment area. More detailed map of Seinäjoki WWTP area highlighting the river section with elevated risk.

Interactive map showing pilot locations. Use the arrow keys to move the map view and the zoom controls to zoom in or out. Press the Tab key to navigate between markers. Press Enter or click a marker to view pilot project details.
Additional links
details
-
Homepage
-
Project typeCore Project
-
ImplementationNovember 2023 - October 2026
-
StatusOngoing
-
Contribution to EUSBSRPolicy Area Hazards

-
Target groups
- Infrastructure and public service provider
- Sectoral agency
-
Social media
-
Additional links
-
Tags